

Strategy & Transformation
How to Calculate ROI for AI and Software Modernization
A practical, finance-ready framework for comparing AI and modernization investment with the current-state cost, realistic benefits, delivery risk and time to value.
operationalwrocław--:-- cet
∕ insights / measuring-project-success.md
Measuring Project Success
Measuring project success the right way: outcome frameworks, SaaS delivery KPIs, governance cadence, and templates for MVP and nearshore teams.
>_article.meta

A green project dashboard can hide a failed business decision. The release arrived, the budget held, and every milestone was marked complete, yet customers didn't adopt the product, support costs rose, or the expected revenue never appeared. That isn't project success. It's delivery activity wearing a success label.
Measuring project success requires a harder question: what changed for the business because this project existed? Technology, code, migration plans, and AI-assisted workflows are means to that end. The useful measures are faster time to market, lower operating cost, increased capacity, reduced risk, stronger quality, improved retention, or revenue growth.
The most popular advice about project success is incomplete. It treats time, cost, and scope as the final answer, when they're only the first inspection.
A SaaS team can deliver an MVP on schedule, within its approved scope, and at the expected cost. If users don't activate, sales can't demonstrate the product, and investors see no credible path to traction, the project hasn't created the intended value. It has completed a build.
The traditional iron triangle remains useful. Schedule variance exposes delay. Budget variance exposes financial control. Scope stability reveals whether the team protected the agreed outcome from uncontrolled change. But those measures tell you what the delivery team did, not whether the organization received the benefit it funded.
Practical rule: Never declare success at release. Declare delivery complete at release, then measure whether the business case survives contact with users and operations.
A better approach to how to evaluate projects starts with the intended outcome, not the task list. For a SaaS MVP, that might mean proving a workflow customers will use, creating an investor-ready product, or shortening the path to market. For a modernization programme, it might mean reducing operational risk, improving platform availability, or lowering the cost of support.
The rest of the scorecard should follow that logic. Track delivery performance, then adoption, operational outcomes, and finally financial or strategic benefits. Each layer answers a different question, and none can substitute for the others.
Delivery scorecards persist because they're easy to inspect. A sponsor can see a planned date, an approved budget, a scope baseline, and a defect count. The harder evidence arrives later, often after the delivery team has moved on and accountability has become unclear.
That creates two two opposite failure modes. A project can be operationally successful yet economically unsuccessful because users don't adopt it or the expected benefit never materializes. A project can also be late and over budget yet strategically valuable if it prevents a serious risk, opens up a critical market, or creates capabilities the original plan failed to anticipate.
The Project Management Institute's 2017 research makes the distinction clear. Organizations with mature benefits-realization practices, called “champions,” completed at least 80% of projects on time and on budget while meeting original goals and business intent, while underperforming organizations achieved those conditions on 60% or fewer projects. Overall project success was 92% among champions compared with 33% among underperformers, and only 31% of surveyed organizations had high benefits-realization maturity (PMI's 2017 Pulse of the Profession report).
That evidence supports a strict separation between two scorecards:
Research involving practitioners in the United States, United Kingdom, and Brazil found that benefits-realization practices explained 9% to 26% of variance in traditional project performance, but 15% to 49% of variance in value-creation outcomes, including ROI and business-case adherence (research on connecting project success to business outcomes). That's the uncomfortable point: teams can become very good at delivering the wrong thing efficiently.
The question most guides avoid is simple: who owns the benefit after handover? The sponsor should name that person before delivery starts. The owner needs a baseline, a target, a reporting cadence, and authority to act when the expected value doesn't appear six or twelve months later.
Treat project success like a medical checkup conducted at different intervals. A release-day assessment tells you whether the procedure finished. It doesn't tell you whether the patient recovered, resumed normal activity, or achieved the original health objective.
Use four layers. They build upward, but they resolve at different times.
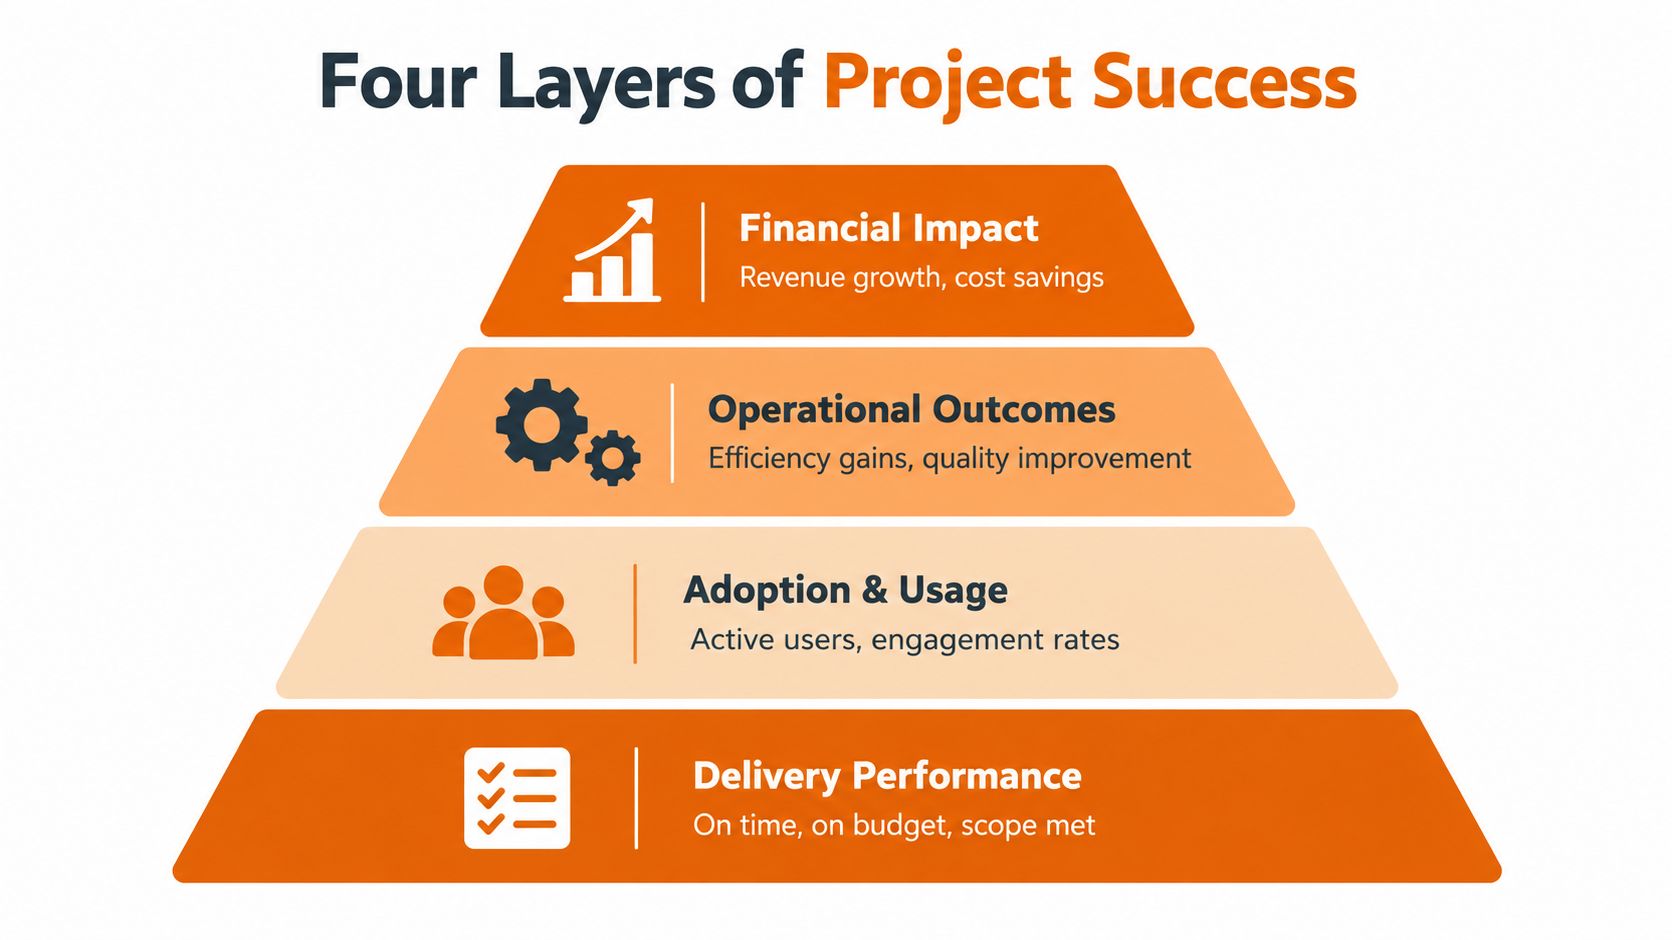
This is the release baseline. Did the team deliver the agreed scope, at the expected quality, within the approved budget and schedule? For a fixed-scope SaaS MVP, evidence includes accepted capabilities, open defects by severity, deployment readiness, and documented decisions.
Delivery performance is necessary because uncontrolled delay and rework consume the resources needed to realize benefits. It isn't sufficient because a technically complete product can still fail in the market.
After release, ask whether intended users perform the target behavior. An MVP might track activation, completion of a core workflow, repeat usage, and account-level engagement. A modernization project might track whether internal teams have moved from the legacy workflow to the new platform.
Adoption is the first serious test of product-market or process fit. If usage stays weak, don't hide behind a completed backlog. Investigate onboarding, workflow design, training, pricing, data quality, and whether the original problem still matters.
Usage should produce an operational change. Measure platform availability, cycle time, support cost, automation rates, incident severity, processing capacity, and quality improvement. A new internal platform that users open but still requires manual work hasn't delivered its operational promise.
This layer needs a baseline before implementation. Otherwise, teams confuse activity with improvement. Record the current process, cost, error pattern, service performance, or throughput, then compare the post-launch state after stabilization.
The top layer tests the business case. Did the project contribute to revenue, retention, margin, cost reduction, risk reduction, strategic capacity, or faster time to market? Attribution won't always be clean, especially when pricing, competitors, staffing, or market conditions change. State the assumptions openly, use a defensible baseline, and revise the benefit case when strategy changes.
Benefits can also decay. A workflow may create savings until usage grows, a model may degrade as data changes, or a platform advantage may disappear when the market moves. That's why the owner remains accountable after handover rather than treating the launch date as the end of measurement.
Use the business impact analysis guidance to connect project decisions to business consequences before the team commits to a delivery plan.
A useful scorecard doesn't collect every available metric. It chooses a small set of measures that expose whether delivery is creating value without transferring cost into operations.
Start with five KPI families. Pair leading indicators, which show whether progress is likely, with lagging indicators, which confirm whether the benefit arrived.
| KPI Family | Example Metrics | How to Measure | When to Review |
|---|---|---|---|
| Business | ROI, revenue contribution, time to market, operating-cost reduction | Compare realized benefit with the approved business case and baseline. ROI can use realized net benefit divided by project investment, with assumptions documented. | At business-case approval, launch, stabilization, and recurring benefits reviews |
| Product | Activation, active usage, engagement, retention, workflow completion | Define the target user action, establish the pre-launch or comparable baseline, and track behavior by cohort or account. | Weekly during early adoption, then monthly |
| Delivery | Lead time for changes, deployment frequency, schedule variance, budget variance | Use the delivery plan for schedule and budget. Use one production-deployment ledger for release-flow metrics. | Weekly during execution and release operations |
| Quality | Change-fail rate, defect escape rate, recovery time, service-level performance | Record deployments that require rollback or hotfix, production defects by severity, and time to restore service after failure. | Per release, weekly trend review, and after incidents |
| Customer | Satisfaction, support cost, retention, complaint themes | Combine a consistent post-release survey with usage evidence, support records, and account-level outcomes. | At launch, stabilization, and monthly or quarterly reviews |
DORA defines change lead time, deployment frequency, failed-deployment recovery time, and change-fail rate as connected signals rather than isolated trophies. Faster lead time matters only when failure rate and recovery time remain controlled. Review the measures together, using medians where exceptional incidents would distort an average, as recommended in the DORA metrics guide.
Cost and schedule measures also need disciplined definitions. Cost variance can be calculated as actual cost minus approved budget, divided by approved budget. Schedule variance can compare the actual completion date with the baseline completion date. Keep the baseline visible, because changing it behind the scenes turns a troubled project into a green report.
Quality and satisfaction deserve equal status with delivery compliance. A peer-reviewed study identifies budgeted cost, scheduled time, desired quality, and stakeholder satisfaction as practical dimensions of project success, and reports that satisfaction partially mediates the relationship between critical success factors and perceived success (peer-reviewed project success measurement research). A release that meets its plan but creates unusable workflows is not a success worth defending.
Measurement works when it becomes part of delivery, not an exercise assigned to someone after release. Use this sequence for a SaaS MVP, a nearshore fixed-scope engagement, or a modernization programme.
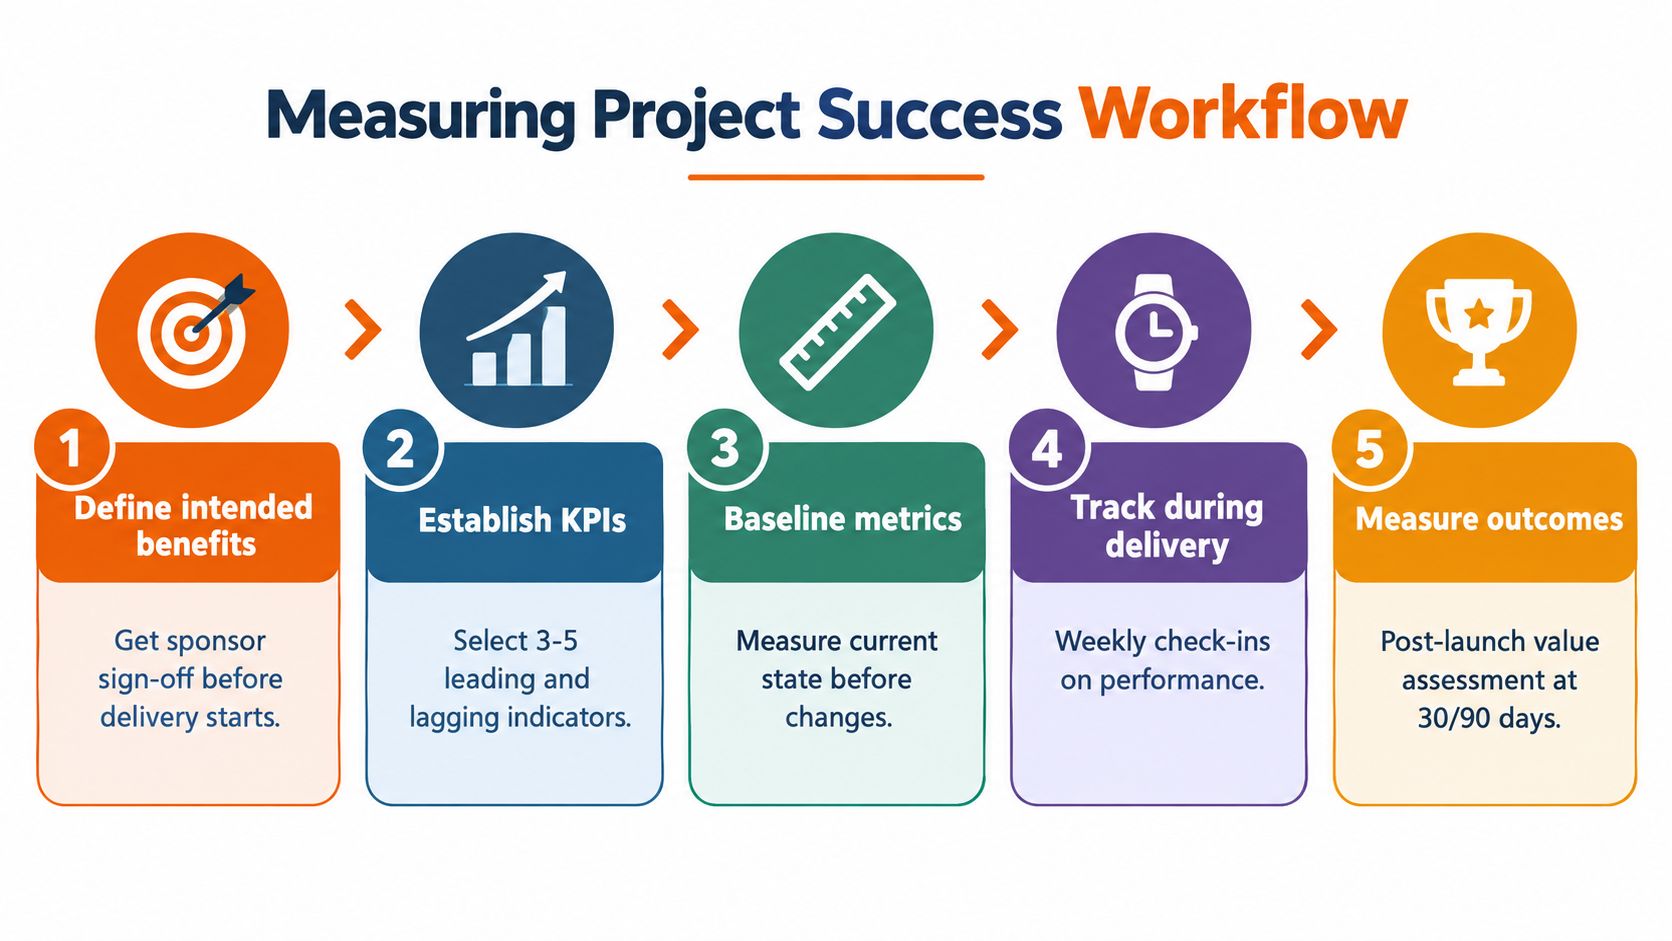
Define the intended benefits before kickoff. The sponsor signs off on the business problem, expected outcomes, assumptions, and decision rights. Write benefits in observable terms, such as shorter time to market, reduced support effort, increased platform capacity, or improved retention.
Select a compact KPI set. Choose three to five leading and lagging indicators. Include at least one delivery measure, one product or operational measure, and one business outcome. Don't accept “build complete” as the only leading indicator.
Establish the baseline. Record the current process, cost, usage, service performance, defect pattern, or risk exposure before changing the system. If there's no baseline, label the result as directional rather than pretending it proves causation.
Assign one accountable owner per benefit. The delivery lead owns delivery evidence. The product or business owner owns adoption. Operations owns service outcomes. The sponsor or benefit owner owns the financial and strategic case after handover.
Instrument evidence during delivery. Connect source control, CI/CD, deployment records, incident records, product analytics, customer feedback, and financial reporting. For mobile products, teams may also need to verify OTA updates in Capacitor so release adoption and update reliability don't remain assumptions.
Review against thresholds and escalate. Hold weekly delivery reviews, examine early adoption after release, and escalate when a threshold is missed. A missed target needs an owner and a decision, not another status colour.
Reassess after stabilization. Review the product or platform after the initial operational noise settles, then revisit benefits at the agreed later checkpoints. Confirm what changed, what caused the change, what decayed, and whether the business case still stands.
A practical gate checklist looks like this:
For a more detailed operating model, use delivery management practices that connect engineering telemetry with decisions rather than treating dashboards as decoration.
A dashboard should help a named person decide what to do next. If it only proves that the team held meetings and closed tickets, it's reporting theatre.
Keep the executive view small. Combine delivery health, product behavior, operational stability, customer evidence, and business benefit. Each indicator needs an owner, data source, baseline, target, threshold, and next review date.
Use different cadences because different signals mature at different speeds:
The reporting process itself affects outcomes. PMI's 2016 study of 717 project professionals found that organizations with high benefits-realization maturity wasted 67% less money on projects and programmes than organizations with low maturity. Organizations with a fully prescribed benefits-reporting process reported 61% of projects meeting or exceeding forecast ROI, compared with 44% where that process wasn't fully established. Fully standardized documentation for benefits metrics was associated with 56% versus 47%, while routine reporting produced 60% versus 47% (PMI research on benefits focus during project execution).
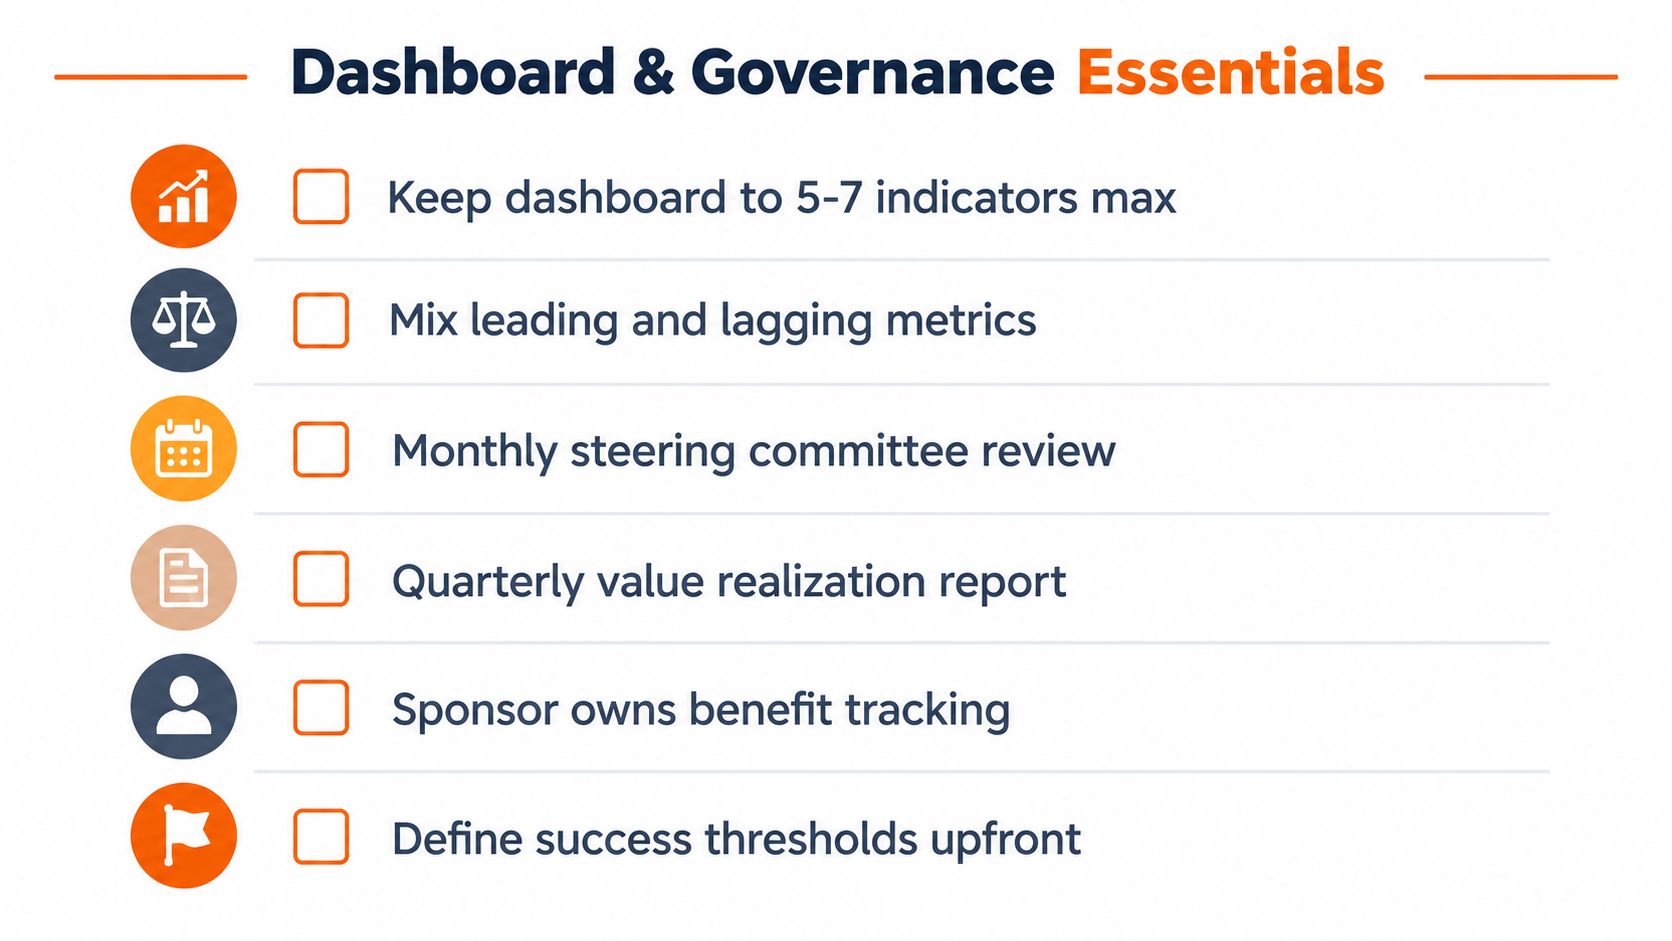
That evidence supports a firm position: benefits reporting is an operating control, not a final report. When usage falls, the product owner changes onboarding or workflow design. When recovery time rises, engineering addresses reliability. When the benefit case weakens, the sponsor changes scope, investment, or strategy.
The common anti-pattern is precision asymmetry. Teams measure delivery adherence every week and benefits realization rarely. Reverse that imbalance. Delivery telemetry protects execution, while recurring outcome reviews protect the reason the project exists.
AI-assisted engineering can increase throughput, but that makes speed a weaker differentiator. If agents accelerate analysis, coding, testing, documentation, and migration, the critical question becomes whether the resulting software is secure, maintainable, reliable, and useful.
A 2025 Enterprise Management Associates survey of 206 IT executives and technical leaders found that 62% cited security and privacy risks as their top AI concern, while 52% were concerned about security vulnerabilities and another 52% about code defects and bugs. The same survey found that 57% of developers spent more time on code review, standards, and quality oversight, while 53% had greater involvement in security, policy, and compliance (Enterprise Management Associates survey findings).
Add guardrails to the scorecard:
AI changes the economics of delivery. It doesn't change who is accountable. Named architects and engineers still own architecture, data, security, testing, integrations, and production quality. Agents can make the work faster, but they can't sign off on an outcome they don't understand.
For practical guidance on connecting AI-assisted work to engineering outcomes, see engineering efficiency principles. The scorecard should reward useful acceleration, not raw code volume.

A VC-backed SaaS team can deliver a fixed-scope MVP in 45 working days, but the release date is only the first layer. The team still needs evidence that target users activate, investors can inspect a credible product, the core workflow performs reliably, and the product supports the intended commercial case. The product sponsor owns adoption and investor-readiness evidence after handover, while engineering owns production quality.
A nearshore modernization has a different shape. The first proof is migration completion, followed by platform availability, incident behavior, user transition, and operating-cost evidence measured after the legacy system is no longer carrying the workload. The technology owner remains accountable for the operational baseline, while the business sponsor owns the strategic and financial benefits.
Take three actions this week:
Measure delivery, but don't stop there. The project earns its success label only when users adopt it, operations improve, and the business receives the value it funded.
Rite NRG helps SaaS teams, scaleups, and enterprises plan, build, modernize, and operate business-critical technology with senior engineering accountability and an AI-native delivery model. If your next project needs outcome-based measurement, predictable delivery, or a responsible path from AI-assisted engineering to production, visit Rite NRG to start the conversation.
/ about the author
Written by the RITE NRG editorial team — the architects, engineers and delivery leads who build and operate AI-era software for our clients.
Strategy & Transformation
A practical, finance-ready framework for comparing AI and modernization investment with the current-state cost, realistic benefits, delivery risk and time to value.
AI Consulting & Automation
A practical framework for choosing and deploying transport or logistics AI agents around real exceptions, reliable data and controlled operational authority.
Industry Solutions
A practical roadmap for improving manufacturing systems and introducing AI without destabilising production, data integrity or operational control.
More guidance: all insights articles
Tell us about the system or idea behind this article. We tell you honestly if it is a fit — and what a fixed-scope delivery could look like.