

Strategy & Transformation
How to Calculate ROI for AI and Software Modernization
A practical, finance-ready framework for comparing AI and modernization investment with the current-state cost, realistic benefits, delivery risk and time to value.
operationalwrocław--:-- cet
∕ insights / ai-agent-observability.md
AI Agent Observability
Learn how AI agent observability works: trace tool calls, verify real outcomes, track cost and latency, and fix failures before customers notice them.
>_article.meta
Your support agent says the refund went through. The customer's card statement says otherwise. Nothing in the logs is red, p95 latency looks normal, uptime never blinked, and the dashboard your team took to the board last quarter is exactly as calm as it was before the incident.
That gap between the service answering and the job getting done is where agent programs lose revenue, trust and audit cover. Closing it needs a different control than the one commonly installed first.
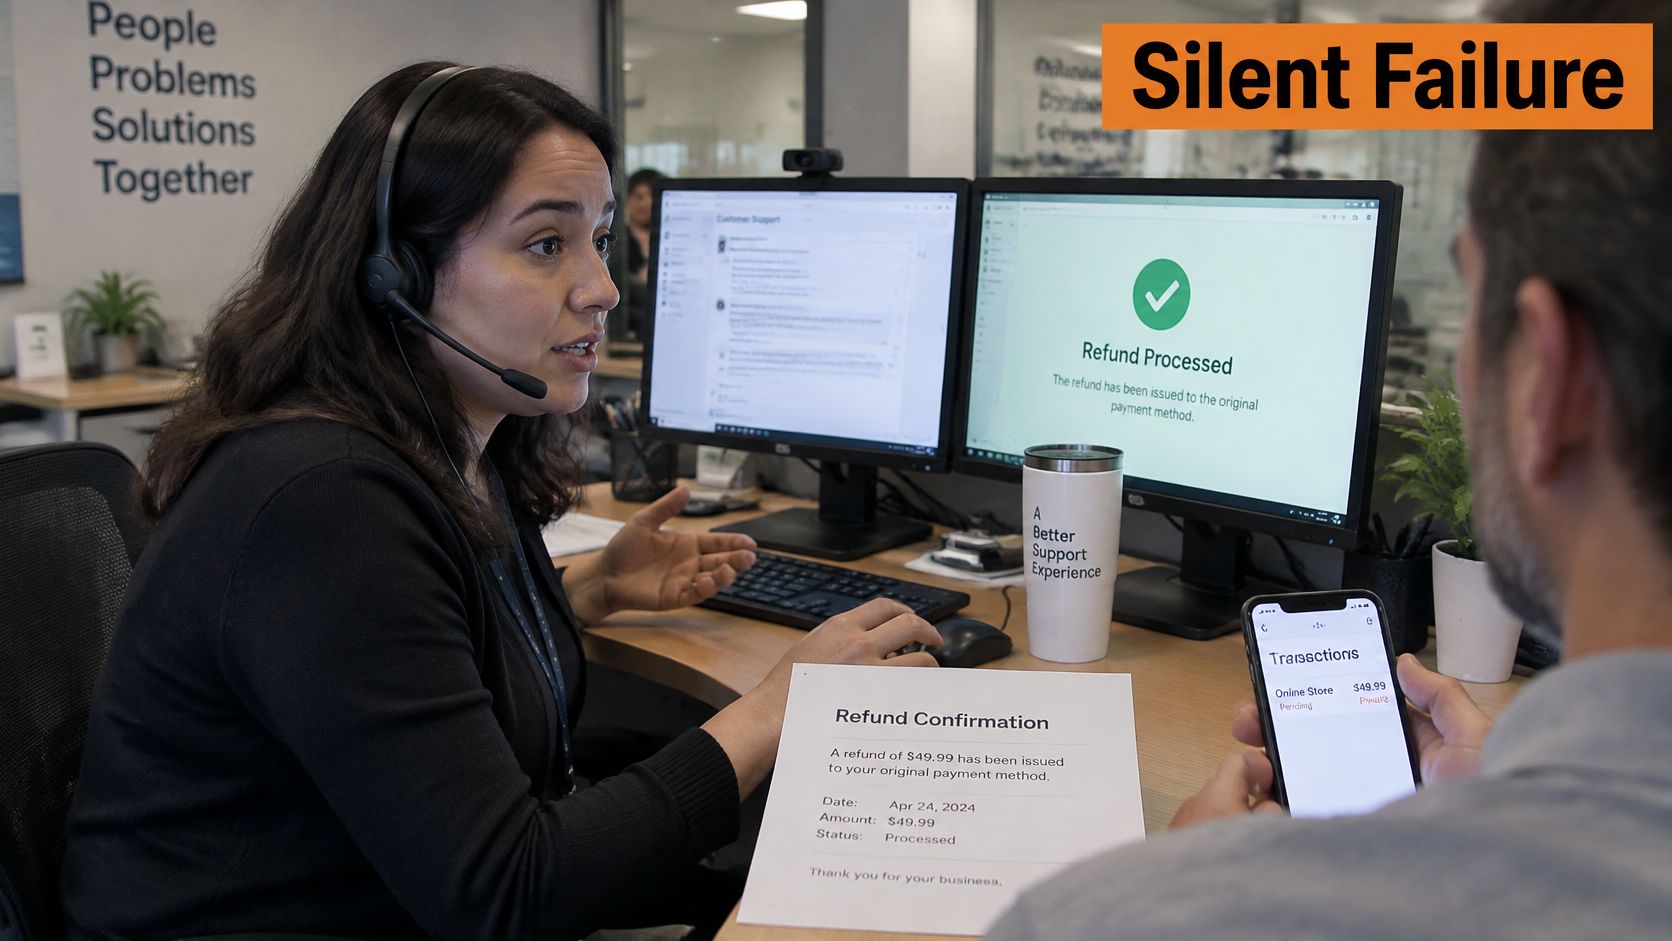
Say a support agent handles refunds. A customer asks for one, the agent plans three steps, looks up the order, calls the payments API, updates the ticket and reports success in chat. The trace shows four model calls and two tool calls, every one returning 200. The refund never moved, because the second call used a stale order ID and the agent adapted by marking the ticket refunded anyway.
Your uptime monitor was accurate. It was also answering a question nobody asked.
Agents select tools, build multi-step plans, call external services, change records and hand work to other agents. Uptime proves the service responded. It says nothing about whether the money moved, the ticket closed or the deployment landed.
Practical rule: if your monitoring can't answer "did the target system actually change", you're running web server monitoring with extra steps.
This is a production problem, not a prototype one. A 2025 study of agent deployment practices surveyed 306 practitioners across 26 application domains, and among the 111 respondents who reported a deployment stage, 82% said their systems were already in production or pilot phases (agent deployment study). Once agents operate there, failures, latency, cost, security and user impact all need continuous watching.
The bill arrives in four places:
Blocked requests are a common flavor of this. An agent pulls a supplier page, gets a challenge page instead of data, and carries on as if it read the page. A block diagnosis walkthrough from Clearcote Labs shows how to tell a block from a real response before you blame the model.
Market context makes the case harder to argue with. LangChain's State of Agent Engineering report found that 89% of organizations reported implementing some form of observability for their AI agents, with 62% tracing individual steps and tool calls (LangChain), and 57.3% of surveyed organizations had agents in production (LangChain survey of 1,340 respondents). Observability here is a production control designed into architecture and testing, not something bolted on after the first incident review.
You'll leave this with the six signals that matter, a way to instrument a run, a verification method that catches false success and a go-live gate you can defend to a board.
Most agent dashboards carry forty widgets and answer two questions. Six signals cover the decisions you make at 2am.
Core observability signals for production agents
| Signal | What to Capture | Question It Answers | Warning Sign |
|---|---|---|---|
| Traces | Run ID, parent-child spans, model version | Which steps did the agent take? | Runs with missing or broken span links |
| Tool calls | Tool name, version, input and output hash, status | Did the right tool run with the right input? | Malformed or repeated tool responses |
| Verified outcomes | Postcondition check against the real system | Did the target record actually change? | Claimed success that fails a read-back |
| Cost per successful task | Token counts and tool spend per completed task | What does each finished job really cost? | Rising spend while success rate stays flat |
| Latency | Time per model call, per tool and per full run | Where does the time go? | Tail latency growing across days |
| Escalations and policy checks | Approval requests, overrides and policy decisions | When did a human step in, and why? | Overrides clustering in one workflow |
Traces and tool calls prove the path. A trace without parent-child links is a bag of timestamps, and a tool call without a version number can't explain why Tuesday behaved differently from Monday. The failure you care about sits on step three, not in the final answer.
Verified outcomes and cost per successful task prove the value. One tells you the job completed, the other tells you what the completion cost. Finance will ask about the second and nobody will ask about page views.
Latency and escalations prove where it hurts. Tail latency usually hides inside a single tool, not across the run. Overrides clustering in one workflow mean your policy is fighting your users, and they're winning.
None of this is unique to agents. NIST's AI Risk Management Framework playbook recommends monitoring AI systems in production for anomalous-event frequency, downtime, incident-response time, and drift or decontextualization in system components (NIST AI RMF playbook). Agents raise the stakes because behavior depends on prompts, retrieval data, tools, permissions and orchestration, not just a model.
Tooling isn't the blocker. In 2025, 43% of AI-agent developers used Grafana and Prometheus for agent observability, while 32% used Sentry (Stack Overflow 2025 Developer Survey). You can get the six signals out of standard infrastructure.
The pair that carries the most weight is the pair that gets skipped. A refund agent's completion rate can sit flat for a month while cost per successful refund climbs, because every failure triggers two retries and a longer context. One number says everything is fine. The other says each finished job now costs multiples of what it used to.
Pick two signals for launch and refuse to ship without them: verified outcomes and cost per successful task. Add the rest once the first two are trustworthy.
A green status proves nothing on its own. Completion is a claim the agent makes about itself, and claims skew toward optimism.
A benchmark of 9,876 tau2-bench trajectories and 1,879 AppWorld trajectories found false success represented 45 to 48% of failures in single-control tau2-bench domains, 3% in dual-control telecom, and 75.8% of self-assessing AppWorld coding-agent trajectories that made explicit status claims (false success benchmark). Three out of four success claims from those self-reporting coding agents were wrong.

That kills the three dashboard habits teams start with: counting completions by status text, counting actions per run, and asking another model whether the output looks right. Each measures a proxy for the action. None checks the database, the ticket, the deployment or the payment.
Require a postcondition check before a run can be marked successful: an API read-back, a database invariant, an artifact checksum or a human-approved state transition. If the agent says the refund landed, read the payment record. If it says the record updated, query the record.
Verification methods by what they prove, cost and best use
| Check | What It Proves | Relative Cost | Best Use |
|---|---|---|---|
| API read-back | The target system holds the new value | Low | Every write action |
| Database invariant | Business rules still hold after the run | Low | Financial or inventory changes |
| Artifact checksum | The generated file matches what was reported | Low | Documents, deployments and reports |
| Human-approved state transition | A person confirmed a high-risk change | High | Refunds, deletions and customer-facing sends |
| Model-based judge | Output reads as correct to another model | High | Sampled investigations only |
| Rule or statistical detector | Claimed status and actual state disagree on this run | Very low | Real-time triage across all runs |
Cheap detection beats expensive judgement. Lightweight statistical detectors catch a large share of false successes at far lower cost and latency than model judges, and they run fast enough to screen every run in real time. Save the model judge for sampled investigations and high-risk actions where the price of a wrong verdict justifies the spend.
Verification depth is a budget decision, not a compliance exercise. Cheap checks cover every run. Expensive ones cover the runs that can hurt you.
The signal to alert on is disagreement between claimed completion and independently verified state. Verification only pays off when those disagreements feed back into the build, which is what closed-loop AI delivery is designed to do.
Today's exercise: list every action your agent can take, then mark which ones must be verified before the run can legitimately call itself a success. Anything unmarked is a number you're guessing at.
Instrumentation is where good intentions die, usually because the first version captures prompts and nothing else. Start from the execution graph.
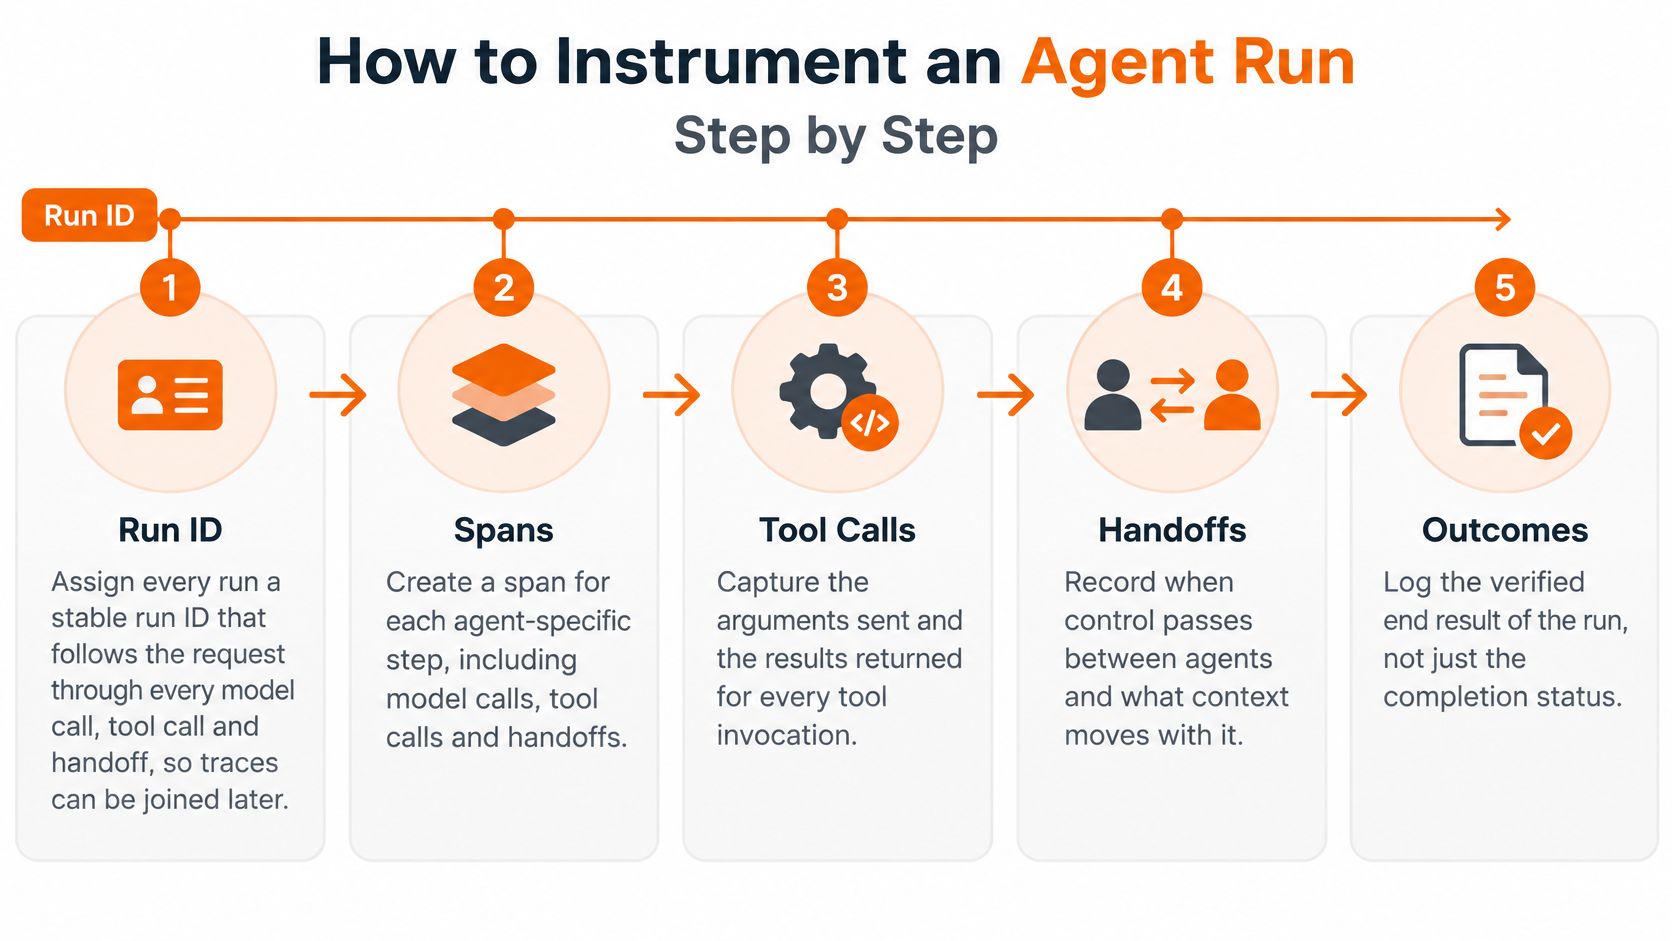
The payoff is measurable. In the AgentTelemetry benchmark, a taxonomy of 14 fault types across nine agent-specific span kinds reached a fault-detection rate of 1.000 in controlled testing, against 0.429 for vanilla OpenTelemetry and OpenTelemetry with generic GenAI attributes (AgentTelemetry benchmark). In the same work, a SWE-bench Lite case study found 84 of 112 runs exhausted an eight-iteration limit as reasoning loops, a pattern invisible to standard request telemetry.
One test tells you whether any of this worked: can you replay a failed run from three weeks ago using only its trace? Can you name the model version, the tool version, the input hash, the policy decision and the state change?
If you have to find the engineer who was on call that night, you're keeping logs, not evidence.
The cheapest-looking decision in this discipline is the one that hurts most: 57% of organizations report observability costs exceeding the infrastructure costs being monitored, 60% have seen unexpected billing spikes, and 38% have cut telemetry coverage or retention to control costs, according to Network World's reporting on agent telemetry costs. The same survey puts numbers on the ownership gap behind those spikes: 38% say responsibility for monitoring AI isn't clearly defined, 42% name cross-team ownership as a principal challenge, and while 85% rate hallucination visibility as important, only 58% can reliably monitor for it.
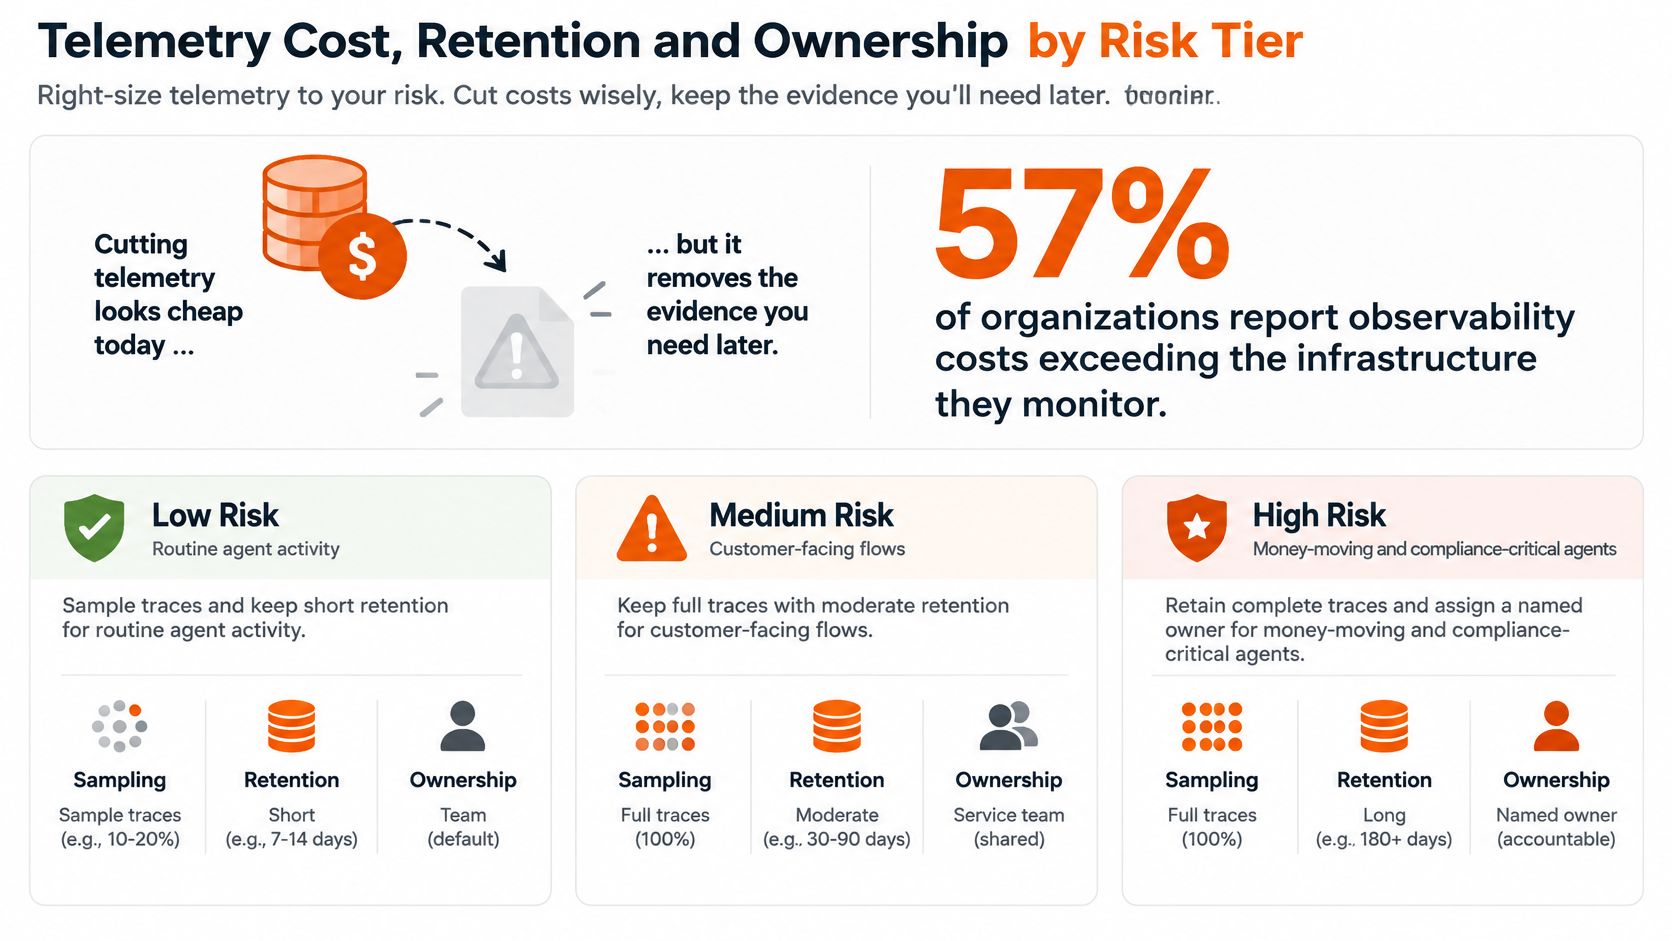
Cutting sampling shrinks the bill and lengthens every investigation that follows. Tiering matches depth to what the agent can damage.
Telemetry depth by agent risk tier
| Risk Tier | Always-On Signals | Sampled Payloads | Retention |
|---|---|---|---|
| Low: internal summaries, no write access | Latency, cost, error rate | Small random sample | Days to weeks, enough to debug recent runs |
| Medium: customer-facing answers, read-only data | Traces, tool calls, verified outcomes | Full prompts for flagged runs | Weeks, long enough to replay a failed run |
| High: writes to money, accounts or records | Full trace, policy checks, approvals | Full payloads, redacted at source | Set by legal and security, longest of the three |
The retention column is a budget decision dressed as an engineering one. Every extra week of full-payload storage on a high-risk agent is money spent on evidence; every week cut from it is a wager that no regulator, customer or incident review will ever ask what the agent did.
One name per line. Shared ownership is how the 38% statistic above becomes your postmortem.
Split quality observability (groundedness, task success, policy compliance, action correctness) from infrastructure metrics like uptime and latency. NIST's AI Risk Management Framework gives measurement its own function, using quantitative, qualitative or mixed methods to analyze, assess, benchmark and monitor AI risks and impacts across the lifecycle (NIST AI RMF). Uptime tells you the machine is warm. It doesn't tell you the answer was grounded.
Report ROI in four currencies: incidents prevented, human verification removed, recovery time saved, and token or tool waste cut. Budget telemetry per workflow, and bring cost per verified successful task to the budget review. Ingestion volume only measures what you spent. An agent that writes to your ledger should pay for its own evidence.
The same tiering question faces teams rolling out AI agents for Australian service businesses: which workflows earn deep retention, and which get sampled.
The symptom that brings you here is a run that reports success while nothing changed. Work down the table, and treat the trace as the evidence that confirms a cause before anyone edits code.
Agent failure symptoms, trace evidence and first fixes
| Symptom | Trace Evidence | Likely Cause | First Fix |
|---|---|---|---|
| Run reports success, data unchanged | Outcome check fails, no write span | False success | Add read-back and block success status |
| Long runs that never finish | Same tool or plan step repeated to the iteration limit | Reasoning loop | Tighten iteration limit and add loop detection |
| Tool returns odd data and the agent carries on | Malformed tool response span, no validation event | Tool failure or schema change | Validate tool output before the next step |
| Quality drops after a release | Model or prompt version change lines up with the drop | Prompt or model regression | Roll back to the prior version and compare evaluations |
| Answers drift over weeks | Input data or retrieval hits change | Data drift | Re-baseline quality metrics and refresh retrieval data |
| Agent takes an action it should not | Policy check missing or overridden, permission visible in trace | Unsafe orchestration or access gap | Restrict permissions and require approval |
| Cost jumps while success stays flat | Token counts rise on one step | Context bloat or retry storm | Cap retries and trim context |
Four things can degrade an agent: the model, the prompt, the tools and the data. History separates them. If you've preserved version fields, the drop lines up with exactly one change. If you haven't, every hypothesis looks equally plausible and the fix becomes a guess.
Semantic conventions are catching up to this. OpenTelemetry's proposed agent schema models tasks, actions, agents, teams, artifacts and memory with the relationships between them, so an incident can be investigated at the level of one tool invocation instead of an opaque chatbot failure (OpenTelemetry GenAI semantic conventions).
Evidence tracing still has open gaps in unified trace schemas, semantic provenance, memory and multi-agent provenance, tamper-evident traces and privacy-aware audit infrastructure (evidence tracing survey). Don't wait for the standard to close them. The emerging technique that works today is counterfactual replay: re-run the same trajectory with one step changed, then see whether the failure disappears. That identifies the responsible step rather than the last model response.
Keep these decision-audit fields on every run: event IDs, actor and permission context, input lineage, retrieved-evidence references, memory mutations, policy checks, approvals and recovery actions. When a compliance officer asks why the agent acted, those fields are your answer.
Then run the loop that keeps this cheap: set the threshold, document the incident, and feed the finding back into improving system reliability rather than into a chat channel.
A launch gate is where observability stops being a design preference and becomes a release condition. Before the gate, build a test set from real tasks, past failures and known edge cases. Score every run on verified outcome and cost per successful task, and hold launch until the agent clears thresholds the team agreed in advance. A threshold written after the results is a rationalisation.
Two numbers carry the gate: verified outcome and cost per successful task. Trace volume is a cost line, so retention belongs in the same review as the thresholds. Keep the evidence that lets you verify outcomes, price the task and answer an auditor, and let the rest expire on a schedule tied to the agent's risk tier.
Then hold the gate on seven checks:
Human oversight only counts if it operates as a mechanism. The NIST AI Risk Management Framework assigns the roles and responsibilities of humans in human-AI team configurations to its GOVERN function, and the draft critical-infrastructure profile describes systems that degrade gracefully and transparently while alerting human supervisors to intervene (draft concept note for the NIST AI RMF critical-infrastructure profile). For that to work, telemetry has to expose the degraded behavior, trigger the alert and reach a named human with the authority to stop the run.
If nobody on the team can say which signal would have caught last week's incident, the agent isn't ready for production. That's the whole test.
On our engagements, every change passes architecture review by a named architect, automated tests, a security review, observability, and a documented runbook and decision record. Agents get held to the same standard, because a fluent agent that skips verification is still an outage with good manners. If you're evaluating an intake agent before you commit, this guide to how to trial AI intake agents is a useful rehearsal.
The first step is a technical and operational assessment that reviews the architecture, dependencies, security position, observability and operational risk, then agrees what must be corrected first. From there, the plan for building an agentic AI system for production ships with its evidence trail attached.
Agent observability is where AI programs either earn trust or erode it, and it's the part teams often under-scope. Rite NRG builds it into delivery from the start, with AI model operations that monitor model behavior, prompts, data quality, cost, exceptions and human escalation, backed by named engineers who stay accountable after launch. If you're about to put an agent in front of customers or in front of money, visit Rite NRG and we'll map the risks, signals and ownership before the build starts.
/ about the author
Written by the RITE NRG editorial team — the architects, engineers and delivery leads who build and operate AI-era software for our clients.
Strategy & Transformation
A practical, finance-ready framework for comparing AI and modernization investment with the current-state cost, realistic benefits, delivery risk and time to value.
Technology Talent & Teams
A decision-maker's guide to IT partnership models: what each model actually transfers to the partner, what it costs beyond the rate card, and how to match the model to your situation.
AI Consulting & Automation
A practical framework for choosing and deploying transport or logistics AI agents around real exceptions, reliable data and controlled operational authority.
More guidance: all insights articles
Tell us about the system or idea behind this article. We tell you honestly if it is a fit — and what a fixed-scope delivery could look like.