
Outcome measurement is the practice of tracking the real-world results a product, feature, or service produces for users and the business, not the volume of work shipped. In England's NHS, system-wide collection of Patient Reported Outcome Measures has run since April 2009, a useful reminder that serious organisations measure change, not activity.
You know the scene. The sprint board is full, velocity is climbing, and the release notes look impressive. Then the founder opens the revenue dashboard and sees retention weakening. Customer success is handling the same objections again, sales is asking for proof that the latest release matters, and product is defending a roadmap that users barely touch.
SaaS teams struggle with this because delivery creates visible evidence while value often appears later and noisier. A completed feature is easy to count. A customer who reaches value sooner, renews, expands, or recommends the product is harder to connect to a specific engineering decision.
At Rite NRG, we use Extreme Ownership, high energy, and proactivity to keep that connection alive. The right team isn't just a list of skills. It takes responsibility for whether the product changes customer behaviour and produces business value.
The Moment Output Stops Being Enough
A product review can look healthy right up until the commercial conversation starts.
The team has shipped the new workflow, closed the backlog items, and improved delivery speed. The product manager presents a clean roadmap burn-up. Engineering explains that the release went smoothly. Then the founder asks the question nobody prepared for: “What changed for customers?”
Silence usually follows.
The gap between busy and better
Three signals tend to appear before the team admits there's a measurement problem:
- Shipping accelerates without commercial movement. More releases don't automatically create more revenue. Technical throughput only matters when it helps customers reach value, stay longer, or buy more.
- Feature adoption remains shallow. A release can be available to every account and still fail to become part of the customer's routine.
- Customer success becomes the translation layer. Success managers keep explaining what the roadmap means because product decisions aren't anchored to the language of customer problems.
This is the gap between output and progress. Output describes what the team produced. Progress describes the change that production created.
Practical rule: Every shipped item needs a clear answer to one question: did customer behaviour or the business result change?
Outcome measurement supplies that discipline. It forces a team to define the intended change before delivery starts, instrument the evidence, and review the result rather than congratulating itself for completion.
The NHS offers a useful contrast. Its PROMs programme compares pre-operative and post-operative patient questionnaires, and NHS England publishes national headline data monthly and organisation-level data quarterly, treating outcomes as a routine statistical system rather than an occasional survey. You can see the same principle in the NHS Outcomes Framework indicators, which support transparency and accountability across hospital and primary care performance.
For a SaaS team, this becomes a daily operating rhythm. The rest of the work is practical: define the outcome, choose the right framework, instrument the journey, review movement, and change course when the evidence says the bet isn't working.
Defining Outcome Measurement for Product Teams
Outcome measurement starts with a distinction many teams skip.
An output is something your team produces. A feature, integration, migration, release, or completed ticket all qualify. An outcome is an observable change in user behaviour or business performance that you can reasonably connect to a product decision. Impact is the longer-term commercial or mission consequence that follows.
Take an in-app onboarding flow:
- Output: the onboarding flow is released.
- Outcome: more new accounts complete the steps needed to reach first value.
- Impact: customers retain, expand, and contribute more commercial value over time.
The release matters only because it might cause the behavioural change. The behavioural change matters because it may contribute to commercial impact.
A working definition
Outcome measurement is the continuous practice of:
- Choosing the user or business change you want.
- Defining a signal that can show whether the change happened.
- Instrumenting the relevant product events and business data.
- Reviewing the signal on a consistent cadence.
- Making a decision based on what the evidence shows.
That sounds simple. SaaS teams still struggle because the true result can appear weeks or quarters after the original decision. Feedback is noisy, accounts behave differently, and teams naturally reach for the proxy that's easiest to count. Page views, tickets closed, daily active users, and story points are useful context, but they aren't outcomes by default.
The NHS PROMs programme demonstrates the core logic clearly. It measures health gain by comparing responses before and after an intervention, then uses the results to assess provider-level care quality. Product teams should apply the same discipline, with a baseline, an intervention, and a meaningful post-change signal.
A good outcome metric has three properties:
- Customer-rooted: it reflects a meaningful improvement in the customer's experience or behaviour.
- Causally linked: the team can explain why its work should influence the measure.
- Decision-shaping: movement in the metric changes what the team does next.
Don't confuse measurement with reporting. A dashboard that never changes a prioritisation decision is decoration.
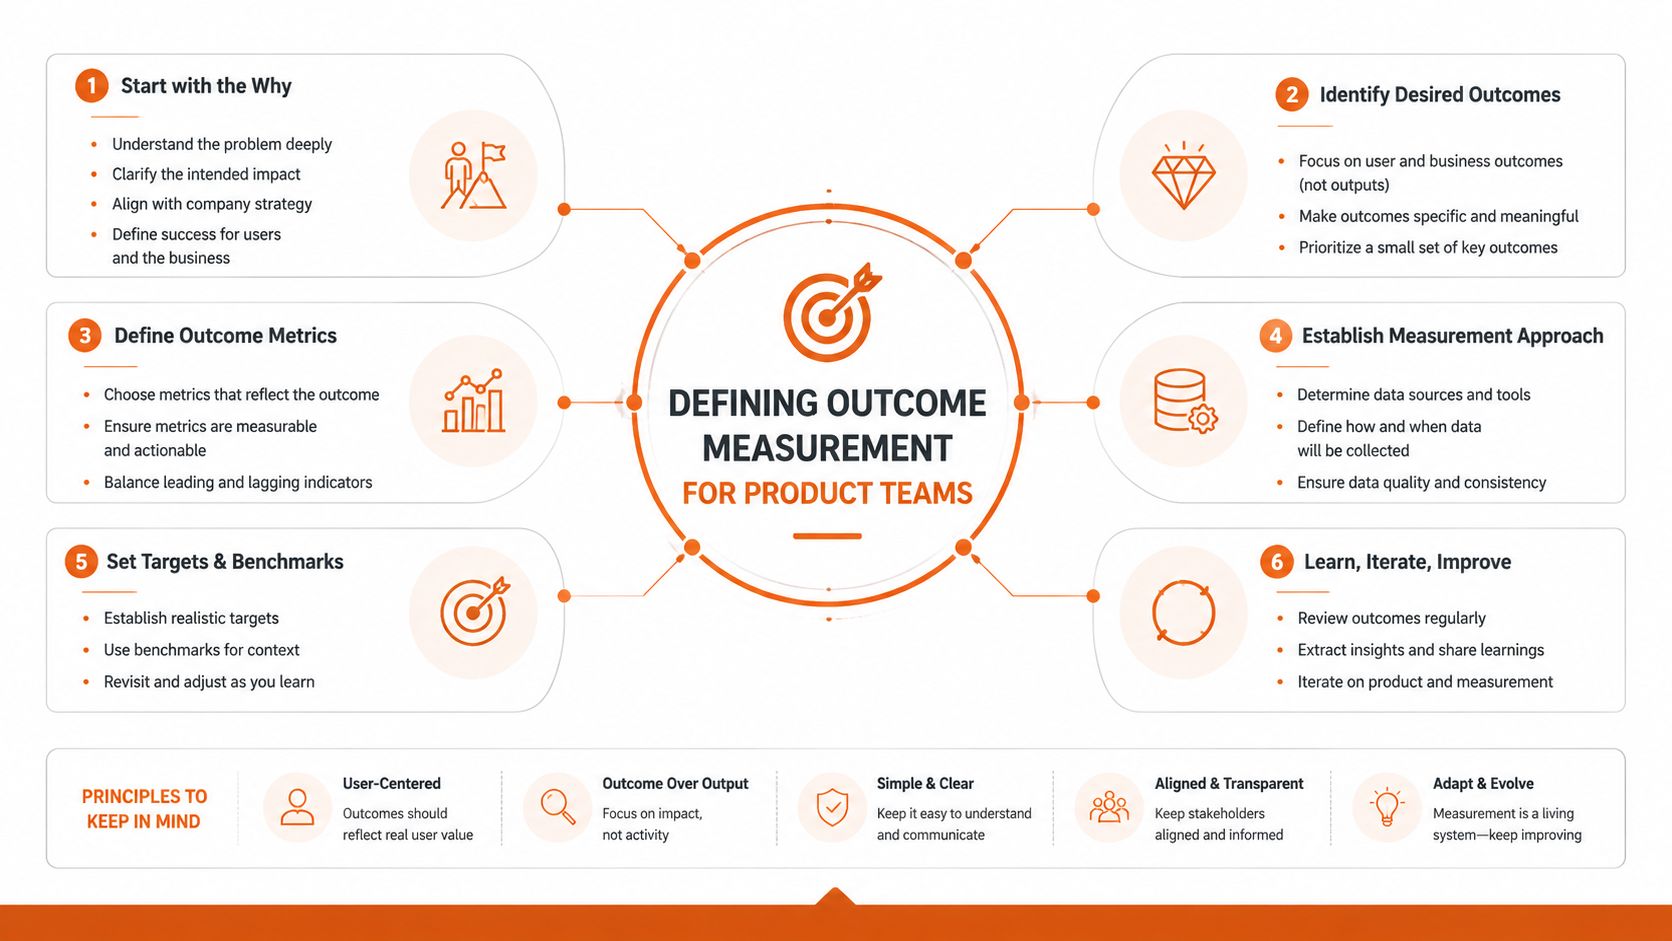
For a practical view of how teams can connect delivery activity with useful productivity signals, see Rite NRG's productivity measurement guide.
The Core Frameworks Every Team Should Know
Frameworks solve different measurement problems. Treating one as the answer to everything creates theatre. Use OKRs for alignment, KPIs for business health, a North Star Metric for customer value, and leading and lagging indicators for timing.
OKRs create a deliberate bet
Objectives describe the change the team wants to create. Key results make that change observable. A strong product OKR doesn't list features as its key results. It might focus on helping new customers reach value, with measurable behavioural evidence and a small set of experiments designed to move it.
The failure mode is turning OKRs into a second project plan. If every key result is a delivery milestone, the team has renamed outputs rather than measuring outcomes.
KPIs protect the business
KPIs are always-on health signals. A SaaS leadership team should understand measures such as activation, retention, NRR, CAC payback, and gross margin because they describe whether the business can acquire, serve, and keep valuable customers.
KPIs shouldn't become a sprawling dashboard. The UK government's service performance guidance takes a similarly disciplined approach, requiring service teams to publish mandatory performance data and derive a small number of service benefits rather than relying only on broad activity measures.
A North Star keeps customer value visible
A North Star Metric represents the customer behaviour most closely associated with sustainable product value. For a B2B SaaS product, that could be weekly active workspaces completing a meaningful workflow, not just users logging in.
The metric needs a clear value definition. “Active” is not enough. A workspace that opens the application and does nothing meaningful shouldn't count as evidence of customer success.
Leading and lagging indicators provide timing
Lagging indicators such as churn or ARR confirm what happened. Leading indicators such as early feature adoption or completion of a critical workflow provide earlier evidence that a bet may be working.
Neither category is sufficient alone. Lagging measures keep the team honest. Leading measures give it something it can still influence.
The table below shows where each framework earns its place.
| Framework | Best For | Cadence | Classic Misuse |
|---|---|---|---|
| OKRs | Aligning teams around a meaningful change | Planning cycle and regular reviews | Listing shipped features as key results |
| KPIs | Monitoring business and product health | Always-on, reviewed regularly | Tracking every available metric |
| NSMs | Connecting customer value to growth | Weekly or monthly review | Choosing a convenient activity measure |
| Leading and lagging indicators | Understanding timing and causality | Weekly leading review, periodic lagging review | Using only lagging results after it's too late |
Delivery metrics still matter, but only when they help explain value creation. Rite NRG's software delivery metrics guide covers how teams can connect events such as deployment, incident detection, and resolution with broader delivery decisions.
A Four-Stage Implementation Rhythm
You don't need a heavyweight transformation programme. A focused team can run this rhythm every two weeks, provided each stage produces a usable artefact and a named owner.
Stage one, frame the hypothesis
Start with a sentence that describes the change you expect:
“We believe improving this part of the journey will help this customer group change this behaviour, which should support this business result.”
Choose one leading indicator and one lagging indicator. Assign one owner, not a committee. The owner coordinates evidence and decisions, while the wider team contributes analysis and delivery.
Artefact: a one-page bet template containing the customer problem, target segment, proposed intervention, expected outcome, indicators, assumptions, owner, and decision date.
Stage two, instrument before building
Confirm that the relevant events exist and mean what the team thinks they mean. Check identities, account relationships, funnel states, cohort definitions, and data freshness. Add guardrails for reliability, support load, performance, or commercial risk.
If the team can't see the baseline before coding starts, it isn't ready to claim success after launch.
Artefact: an instrumentation checklist that records each event, its definition, source, owner, validation status, and dashboard location.
Stage three, execute and review movement
Ship the smallest useful intervention. In the weekly check-in, review movement on the leading indicator first. Completed tickets belong in delivery notes, not at the centre of the outcome conversation.
Ask three direct questions:
- What changed in customer behaviour?
- Which segment moved, stalled, or regressed?
- What evidence should change this week's decision?
Artefact: a weekly scoreboard showing the outcome, leading signal, lagging signal, guardrails, qualitative feedback, and current confidence.
Stage four, decide and record
At the end of the cycle, compare the evidence with the original hypothesis. Don't rewrite the hypothesis to make the result look better. Decide whether to scale, iterate, or kill the bet.
Capture what changed, what didn't, which assumptions failed, and what the team will do next.
Artefact: a decision log. It prevents the organisation from repeating the same experiment under a different project name and gives new team members the reasoning behind past choices.

Tooling and Reporting That Actually Get Used
The tooling market is crowded because measurement sounds like a software problem. It isn't. Tools expose patterns, but they can't rescue vague definitions or weak ownership.
Choose by use case.
| Category | Primary Use Case | Representative Tools | Selection Criteria |
|---|---|---|---|
| Product analytics | Behavioural funnels, paths, and cohort retention | Mixpanel, Amplitude, Heap | Event taxonomy, identity resolution, analysis speed |
| OKR and goals platforms | Structuring outcome commitments and reviews | Perdoo, Quantive, Ally.io | Workflow fit, visibility, review discipline |
| Dashboarding layers | Turning warehouse data into leadership views | Looker, Metabase, Mode | Data access, governance, refresh needs |
| Revenue attribution | Connecting product behaviour with ARR | Bizible, Factors, custom warehouse models | Account matching, attribution assumptions, integration cost |
Build the smallest stack that survives Monday morning
A product analytics platform is appropriate when the question concerns user behaviour. A dashboarding layer earns its place when leadership needs a stable view across product, finance, and customer success. Revenue attribution requires extra caution because connecting usage to ARR involves assumptions about timing, account structure, and influence.
OKR software helps only if teams already review commitments. Otherwise, it becomes a beautifully organised archive of abandoned intentions.
Before buying anything, check:
- Definitions: Can the system preserve a shared event and metric taxonomy?
- Integration: How much work does it take to connect product, CRM, billing, and warehouse data?
- Cadence: Will the owner open it during the weekly review?
- Decision path: Does a metric lead to a clear action when it moves?
- Governance: Can someone explain who owns the data and how it was calculated?
Teams looking to make measurement collaborative can also use this performance measurement guide from United We Transform as a practical reference for involving the people who deliver and consume the measures.
Rite NRG fits naturally in the delivery layer of this system. Its product-first consulting and engineering teams help connect technology decisions, delivery processes, and measurable business outcomes rather than treating implementation as an isolated coding exercise.
Real-World Examples From SaaS Delivery
The pattern becomes clearer when you compare two delivery rooms.
The first team is a mid-market B2B SaaS business with a busy onboarding roadmap. Product had been reporting completed features, while customer success kept hearing that new accounts struggled to reach their first meaningful result. The team replaced completion reporting with an activation-rate North Star, mapped the onboarding path, and instrumented the events that showed whether an account had completed the critical workflow.
The team then used a small bet template, a weekly scoreboard, and customer interviews to identify where accounts stalled. It prioritised changes that removed friction from that path instead of adding more configuration options. Over two quarters, the team recovered stalled net revenue retention, but the important lesson isn't the result alone. The team changed its operating question from “what did we release?” to “which customer behaviour moved?”
The second team had the opposite experience. A growth-stage SaaS company celebrated rising daily active users and releases arriving on schedule. Leadership felt the product was gaining momentum, yet churn weakened expansion revenue.
A cohort analysis separated casual activity from valuable account behaviour. The team discovered that the growth in daily activity was concentrated in users who weren't completing the workflows associated with renewal. That finding forced a difficult pivot back to qualitative interviews, because the dashboard showed what users did without explaining why they stopped seeing value.
The contrast is useful:
- Measure meaningful behaviour: Activity only matters when it represents customer value.
- Segment before celebrating: Aggregate growth can hide deterioration in the accounts that matter most.
- Pair data with conversations: Product analytics identifies the pattern, while customer feedback often explains it.
- Record decisions: A decision log makes the reasoning visible when the roadmap changes.
A disciplined customer feedback loop keeps qualitative evidence connected to the metrics rather than treating interviews as a separate research ceremony.
Common Pitfalls and How to Avoid Them
Outcome measurement fails when teams use it to create more reporting instead of better decisions.
Dashboard inflation
Symptom: Every function adds another chart, but nobody can name the metric that would change next week's priorities.
Why it feels productive: More visibility looks like more control. In practice, the team spreads attention across signals with different definitions, owners, and time horizons.
Antidote: Remove any chart that has no named decision attached. Keep a small operating scoreboard and move exploratory analysis elsewhere.
Vanity-metric worship
Symptom: Daily active users, sign-ups, or feature adoption rise while valuable accounts remain frustrated or leave.
Why it feels productive: The graph moves upward and gives the team a clean success story.
Antidote: Segment the measure by account type, lifecycle stage, and meaningful workflow completion. Ask whether the behaviour represents value, not just presence.
Lagging-only measurement
Symptom: The team reviews churn or ARR after the commercial damage is already visible.
Why it feels productive: Lagging metrics feel definitive.
Antidote: Pair every lagging indicator with a leading behavioural signal that the team can influence during the cycle.
Gameable incentives
Symptom: People optimise the number attached to their bonus while customer experience deteriorates.
Why it feels productive: Incentives create urgency, but a narrow target invites local optimisation.
Antidote: Use outcome measures for learning and accountability, then add guardrails and qualitative review before tying them to compensation.
Activity mistaken for traction
Symptom: Releases arrive on time, tests run, and tickets close, but the intended customer behaviour doesn't change.
Why it feels productive: Delivery activity is concrete and familiar.
Antidote: Require a written hypothesis before work begins and review the result after launch. Don't call an experiment successful because it shipped.
The strongest habits are simple:
- Review metrics weekly: Focus on movement and decisions, not presentation polish.
- Keep written hypothesis logs: Preserve the original belief so teams can learn authentically.
- Assign one North Star owner: One person coordinates definitions, evidence, and follow-through.
- Read qualitative evidence: Interviews, support conversations, and sales objections explain patterns dashboards can't.
- Retire dead measures: A metric that no longer shapes action is operational clutter.
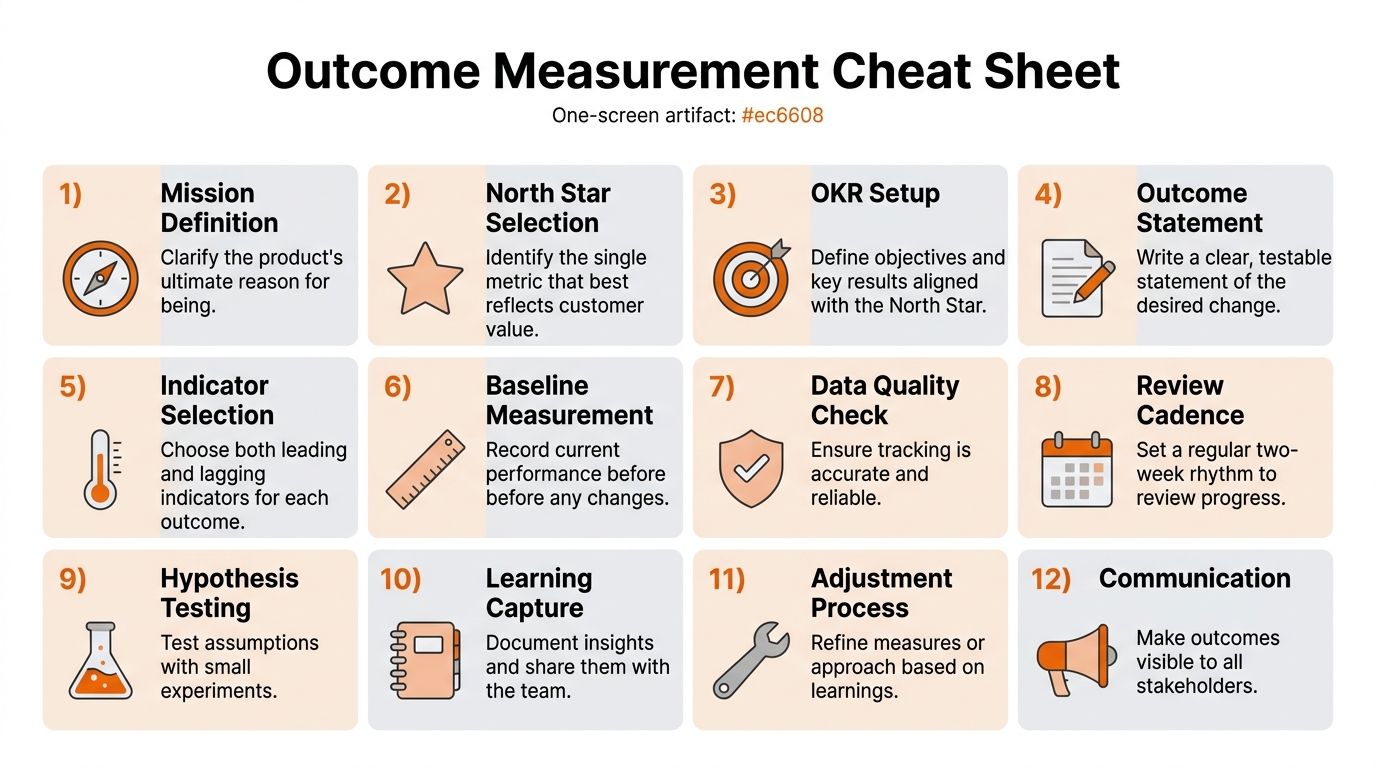
Checklist, Cheat Sheet, and FAQ
Pin this checklist where product, engineering, and commercial leaders can see it:
- Define the mission: Clarify why the product exists.
- Choose the North Star: Select the customer behaviour that best reflects value.
- Set clean OKRs: Tie objectives to measurable change, not feature completion.
- Write the outcome statement: Describe the expected behavioural or business shift.
- Select indicators: Pair a leading signal with a lagging result.
- Record the baseline: Know the starting position before changing the product.
- Check data quality: Validate events, identities, cohorts, and dashboards.
- Set the cadence: Review progress every two weeks.
- Test the hypothesis: Run the smallest useful experiment.
- Capture learning: Write down what the evidence says.
- Adjust the plan: Scale, iterate, or stop the bet.
- Communicate clearly: Make outcomes visible to every relevant stakeholder.
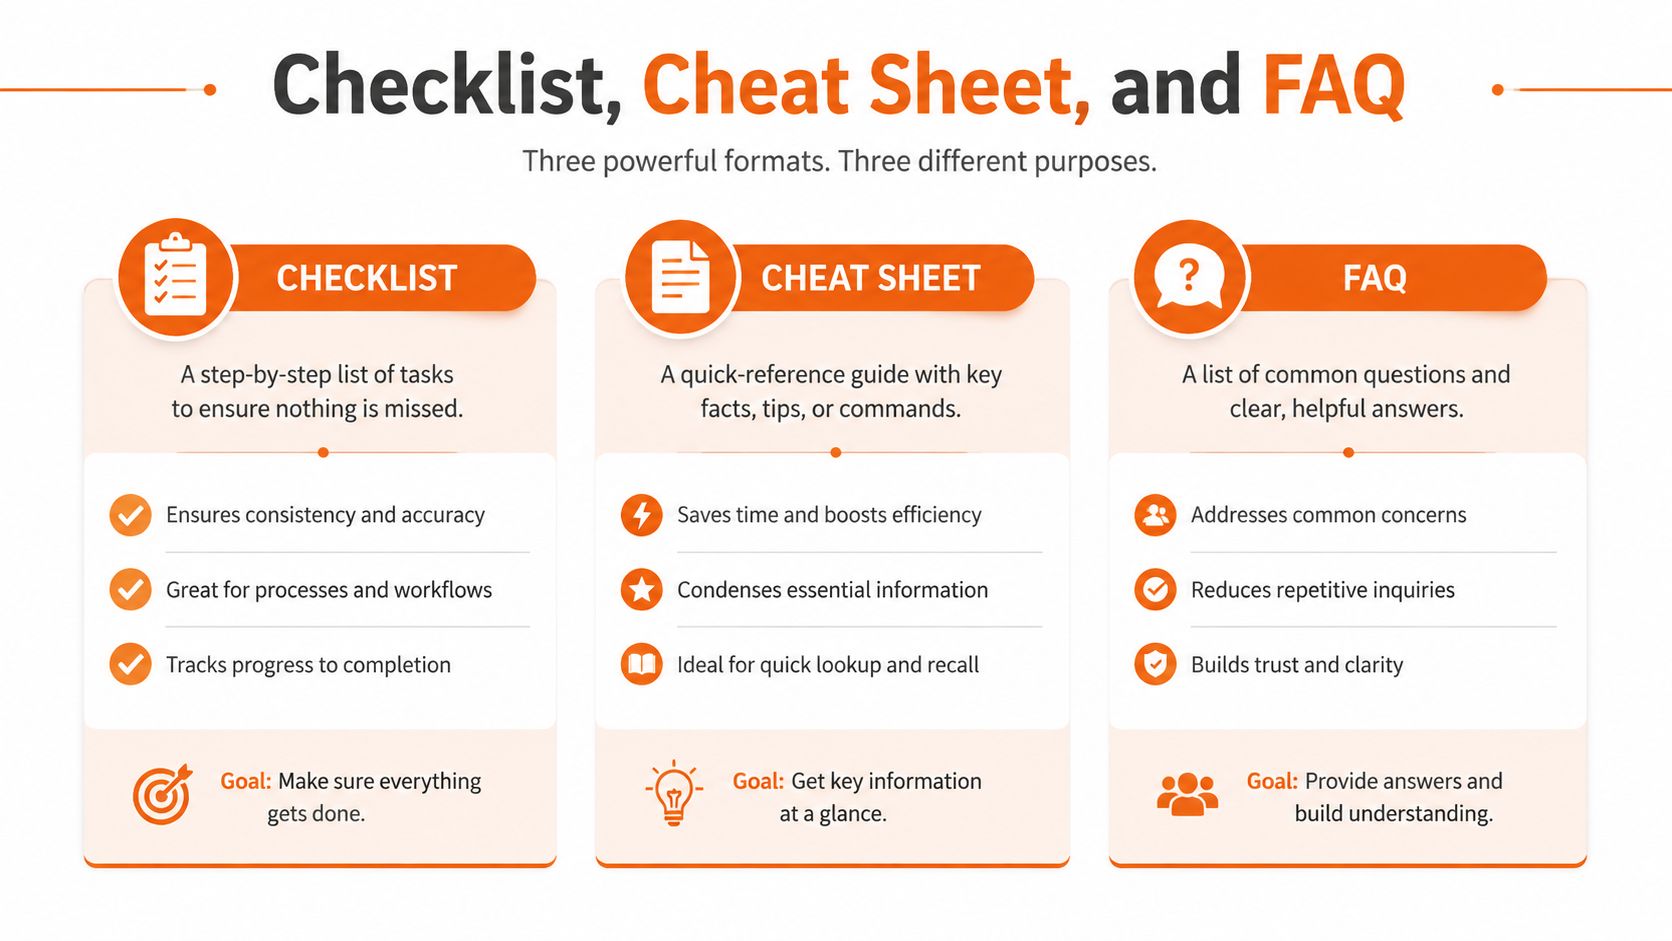
FAQ
How does outcome measurement differ from impact measurement?
Outcome measurement tracks nearer-term behavioural or performance change. Impact measurement looks at the longer-term commercial or mission consequence. Connect them, but don't pretend they're the same signal.
When should we retire a metric?
Retire it when it no longer represents customer value, can't be trusted, or doesn't change a decision. Replace it only after defining the new measure clearly.
How do we start without analytics?
Choose one valuable customer behaviour, establish a manual baseline, and instrument only the events needed to test the first hypothesis. Don't buy a platform before definitions are stable.
How should multi-product portfolios measure outcomes?
Give each product its own behavioural measures, then connect them to shared commercial outcomes. Avoid forcing unrelated products into one artificial North Star.
What if engineering velocity rises while outcomes fall?
Treat it as a prioritisation or product-learning problem, not an engineering failure. Review the hypothesis, customer evidence, segmentation, and guardrails before asking the team to ship faster.
Outcome measurement isn't a quarterly ritual or a reporting layer added after delivery. It's the operating discipline that helps a product team decide what deserves energy, what needs changing, and what should stop.
Rite NRG offers product-first consulting, senior nearshore engineering teams, platform development, and delivery advisory built around measurable customer and business outcomes. If your roadmap is busy but value is hard to prove, visit Rite NRG to start a focused conversation about turning delivery into predictable progress.