Most advice on software delivery metrics is stuck in the wrong decade. It tells CTOs to track velocity, story points, utilisation, and commit counts, then act surprised when the board still asks one brutal question: “How is engineering moving the business forward?”
A dashboard full of green charts means nothing if onboarding is still slow, releases still create support load, and investors still can't trust the roadmap. That's the problem. Teams are measuring activity and calling it performance.
The fix is straightforward. Stop treating metrics as developer theatre and start using them as operating signals for time to value, delivery predictability, and customer impact. That's the only conversation worth having with leadership. The #riteway methodology leans hard into this. Extreme Ownership, high energy, and proactivity turn metrics from passive reporting into levers you can pull.
Metrics should answer business questions. If they only describe engineering motion, they're incomplete.
Moving Past Vanity Software Delivery Metrics
Vanity metrics create false confidence.
A sprint can look productive on paper while revenue-impacting work sits in review, launch dates slip, and customers wait too long to see value. If your dashboard focuses on effort instead of outcomes, leadership gets noise instead of control.
What vanity looks like in practice
The pattern is easy to spot. Engineering reports velocity. Product reports tickets closed. Finance still cannot trust launch timing. Customer Success still deals with the same avoidable issues after release.
Those metrics show motion inside the team, but they do not show whether the company is getting faster at delivering value.
Common offenders include:
- Story points completed. Fine for team-level planning. Weak for board-level decisions.
- Lines of code written. More code usually increases maintenance and risk.
- Raw commit counts. A high number can mean disciplined delivery or constant churn.
- Utilisation percentages. Full calendars often create slower flow, more handoffs, and longer queues.
The same principle shows up outside engineering too. Teams get better decisions when they separate signal from surface-level activity, which is why improving UX with leading and lagging indicators matters for product leaders as much as DORA matters for CTOs.
What leaders should ask instead
Executives need questions that connect delivery to commercial performance.
| Leadership question | Better metric lens |
|---|---|
| How quickly can we respond to a market opportunity? | Lead time and deployment frequency |
| How risky is each release? | Change failure rate |
| How exposed are we when production breaks? | MTTR |
| Are we creating business value, not just shipping? | Time to value and stakeholder alignment |
| Can we forecast credibly? | Delivery accuracy and sprint goal accuracy |
This shift changes the conversation with the board. You stop reporting how busy engineering was. You start showing how reliably the business can turn priorities into production outcomes.
That matters even more in a nearshore model. If delivery spans time zones, handoffs, and multiple stakeholders, weak metrics hide delay until it hits the roadmap. The right metrics expose bottlenecks early, protect predictability, and give SaaS leaders a cleaner view of Time to Value.
The #riteway lens
Strong delivery teams use metrics to drive action. They review signals early, assign ownership fast, and fix the system before a small delay becomes a missed quarter.
That is the standard. A proactive delivery partner should challenge soft assumptions, trace friction across the pipeline, and connect engineering performance to customer impact and forecast confidence. That is how software delivery metrics become a business lever instead of a status report.
The Four Core Metrics That Actually Matter
If you only track four operational metrics, track the DORA set. Not because they're fashionable, but because they force balance between speed and resilience.
Think of your engineering organisation like a Formula 1 team. Fast lap times matter. So do pit stops, recovery under pressure, and not setting the car on fire every race weekend. You don't win by being fast in one corner. You win by running the whole system well.
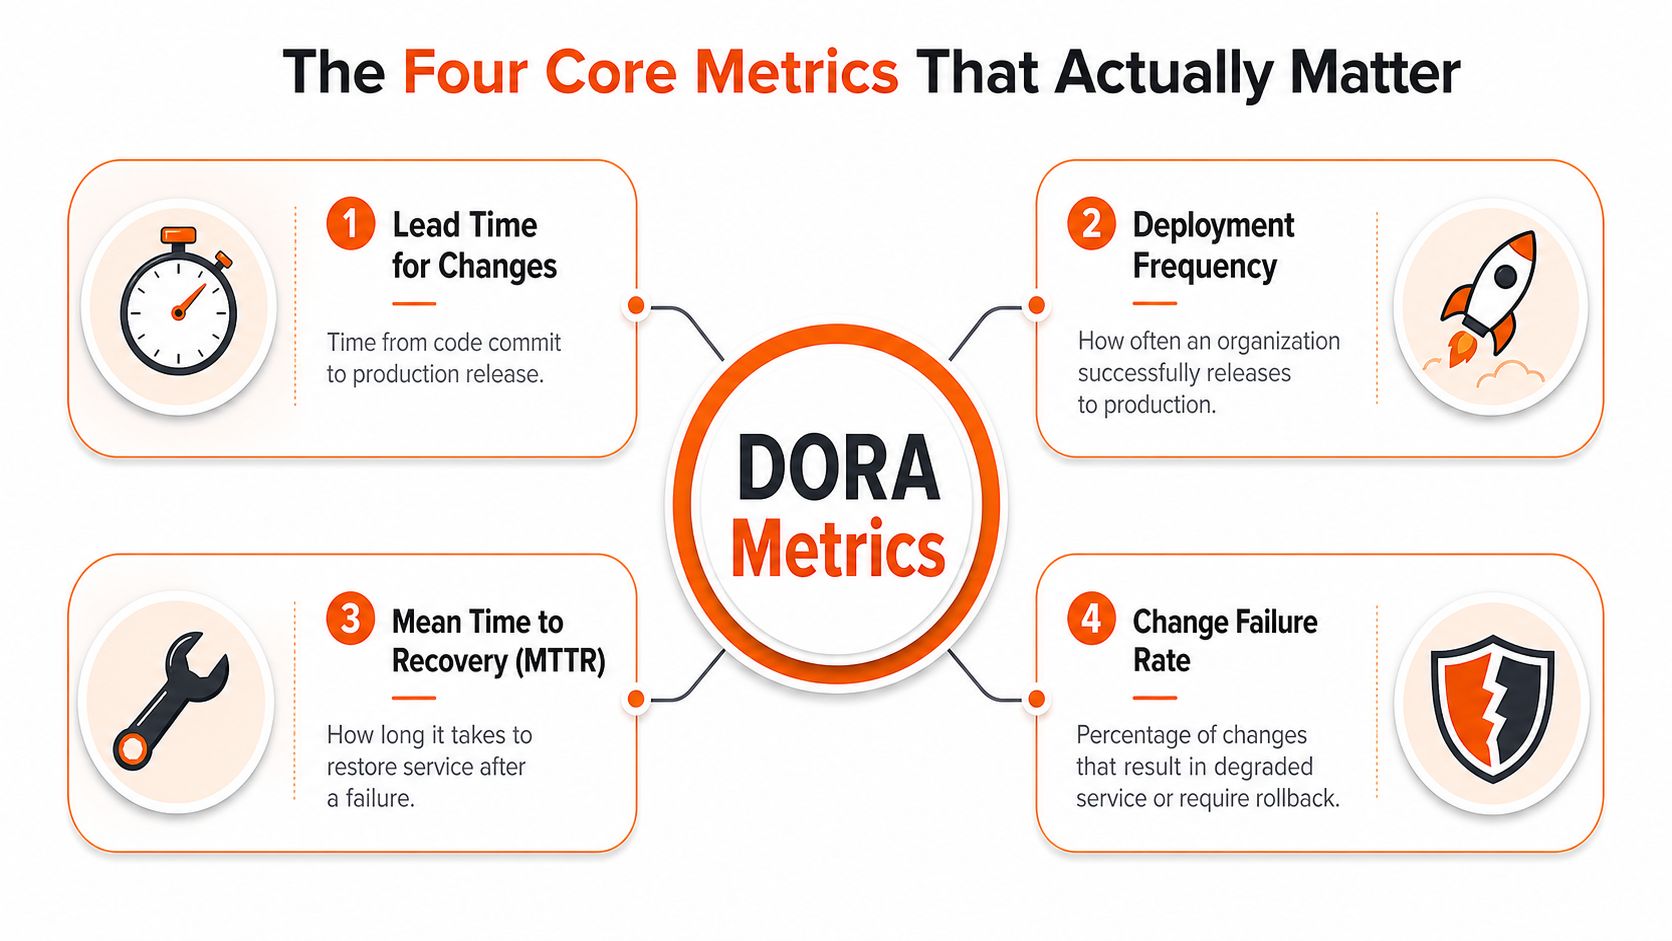
Lead time for changes
This tells you how long it takes to move from code commit to production.
For a SaaS CTO, the question is simple. How fast can we turn a decision into customer value? If lead time is slow, your problem usually isn't coding speed. It's approvals, reviews, unclear ownership, brittle testing, or a release process nobody trusts.
A healthy lead time lets product test ideas sooner, sales close with confidence, and leadership respond to market pressure without a quarter-long lag.
Deployment frequency
This tells you how often your team successfully releases to production.
The business translation is clear. How often do we create opportunities to learn? More deployments mean more chances to validate assumptions, reduce release batch size, and avoid the dangerous pattern of “big launch, big risk”.
This also connects to broader product thinking. If you want a clean explanation of how leading and lagging indicators shape better decisions, improving UX with leading and lagging indicators is a useful parallel. Delivery frequency is a leading indicator of learning velocity when the rest of the system is healthy.
Mean Time to Restore
MTTR measures how quickly your team restores service after a failure.
This is not just an ops metric. It tells you how expensive your incidents are in trust, distraction, and commercial risk. A short MTTR means your team contains damage quickly. A long MTTR means support queues swell, product delivery stalls, and leadership spends time in incident calls instead of growth decisions.
Practical rule: If your team treats incidents as isolated support events instead of delivery-system feedback, MTTR will stay stubbornly high.
Change failure rate
This is the percentage of changes that degrade service or require remediation.
For executives, this answers one question. How often does shipping hurt us? If this number is high, your throughput is fake. You're not delivering faster. You're creating rework faster.
Change failure rate also protects you from worshipping speed in isolation. A team that deploys constantly but breaks production too often isn't high performing. It's just noisy.
What good looks like in the UK
The benchmark gap is not subtle. High-performing UK teams report a median Lead Time to Change of 4.5 hours, with the top 10% achieving under 2 hours, while low performers average 18 hours or more. Deployment frequency for elite UK teams reaches 15+ deployments per day, whereas average teams deploy only 2–3 times weekly. The UK's Mean Time to Restore benchmark is 45 minutes for high performers, with change failure rates below 5%, according to the UK software measurement analysis published by The Software Coach.
Read them as a system, not as isolated charts
Don't let your team optimise one metric at the expense of the others.
Use this operating logic instead:
- Fast lead time plus low failure rate means your pipeline is trustworthy.
- High deployment frequency plus poor MTTR means your recovery discipline is weak.
- Low failure rate but very low deployment frequency often means fear is blocking progress.
- Good technical metrics without business movement means you still haven't connected delivery to value.
That last point is a common failing point. The board doesn't care that engineering got more efficient in a vacuum. It cares whether the business can move faster with less risk.
How to Measure and Instrument Your Delivery Pipeline
Teams often overcomplicate measurement. They assume they need a giant platform initiative before they can trust the numbers. They don't.
You need a clean event trail across your delivery pipeline. That means capturing the right timestamps, statuses, and operational signals from the tools you already use. GitHub, GitLab, Bitbucket, Jira, Linear, Jenkins, GitHub Actions, CircleCI, ArgoCD, Datadog, Grafana, Sentry, PagerDuty. The stack can vary. The instrumentation logic doesn't.
Capture the moments that define flow
You can't measure lead time if you only record when work started in Jira. You need timestamps that reflect actual movement through the system.
Collect these events consistently:
- Commit created. This starts the clock for change flow.
- Pull request opened and merged. This exposes review queue time and approval friction.
- Build started and completed. This reveals CI bottlenecks and flaky pipelines.
- Deployment started and finished. This marks production movement and release cadence.
- Incident detected and resolved. This powers MTTR and recovery analysis.
Each event should include enough metadata to connect it to a service, repository, environment, and team. Otherwise your dashboard will look polished and still be useless.
Build a single operational narrative
The goal isn't “more observability”. The goal is one shared version of reality.
A good instrumentation model links work items, code, deployments, and production outcomes. When a release goes live, you should be able to see what changed, who approved it, what customer-facing capability it affected, and whether it caused an incident. That's how a CTO gets from technical telemetry to delivery insight.
A nearshore setup makes this even more important. When teams span locations, shared data beats status meetings. A transparent pipeline removes interpretation gaps and reduces the usual “we thought it was done” nonsense.
For teams improving mobile and front-end observability, logging practices for React Native offers a practical view on capturing production signals that engineering teams often miss.
Instrument with low friction
If measurement creates admin work for engineers, adoption will collapse.
Use automation wherever possible:
| Pipeline stage | What to instrument | Why it matters |
|---|---|---|
| Version control | Commit, PR, merge timestamps | Measures flow and review delay |
| CI | Build duration, test pass/fail, reruns | Exposes quality friction |
| CD | Deployment success/failure, environment, timestamp | Measures release cadence and reliability |
| Monitoring | Error spikes, alerts, incidents | Connects delivery to production health |
| Issue tracking | Story status changes, blocked states | Shows queue buildup and handoff waste |
The reporting layer should aggregate. It should not ask engineers to manually maintain dashboards after the fact.
Add observability, not just delivery reporting
A lot of CTOs stop at Git and CI/CD. That's incomplete. You also need production truth.
If your system can't connect deployments to latency spikes, incident alerts, rollback events, and support pain, your metrics will flatter the pipeline and hide the customer experience. Strong monitoring and observability practices close that gap by tying release activity to live operational behaviour.
A delivery dashboard without production feedback is just a release diary.
Start narrow, then harden the model
Don't try to instrument every service, every team, and every edge case at once.
Start with one product area or one stream of work. Validate that timestamps are trustworthy, deployment events are consistent, and incident ownership is clear. Then expand. CTOs get better results when they treat measurement like product development. Small scope, fast feedback, then scale.
Connecting Delivery Performance to Business Outcomes
Boards do not fund engineering because lead time looks good on a dashboard. They fund engineering when faster, safer delivery shows up as earlier revenue, lower churn, better retention, and fewer execution surprises.
That is the standard your metrics need to meet.
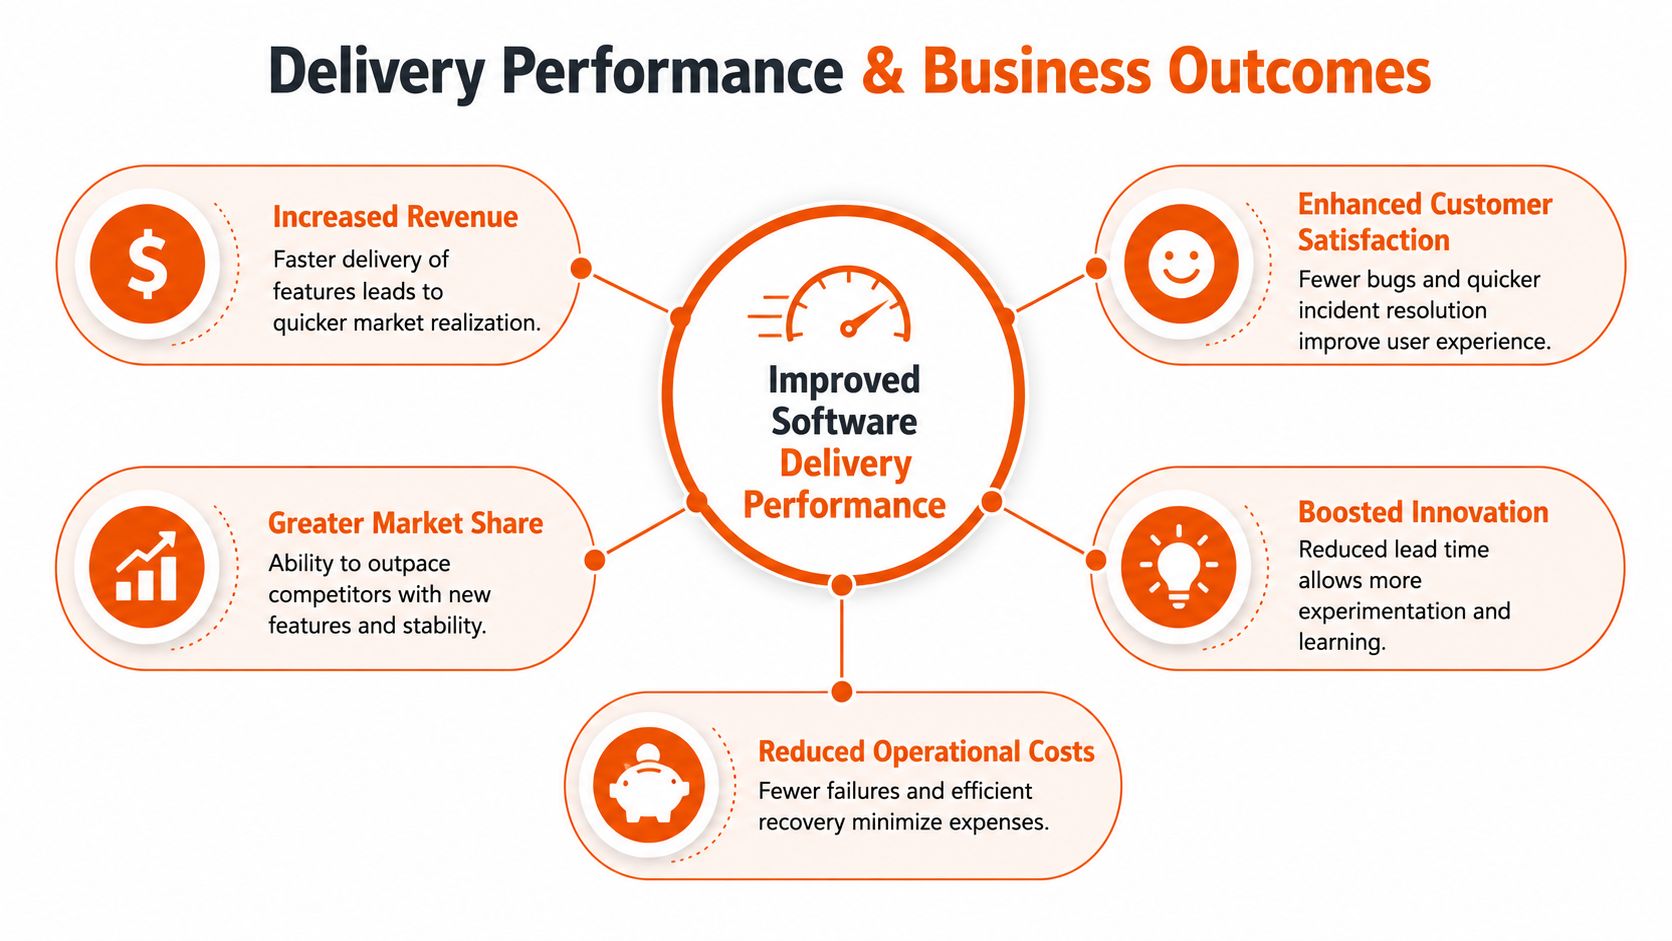
Translate each metric into executive language
Executive teams do not need a tour of your pipeline. They need a clear view of business exposure and business upside.
Use this translation model:
- Lead time means speed from decision to customer impact. Product can test demand sooner, sales can support launches faster, and the business waits less time to see whether an investment pays off.
- Deployment frequency means learning speed. More safe releases create more chances to validate pricing, onboarding, conversion, and retention bets.
- MTTR means contained commercial risk. When incidents end fast, trust recovers faster and disruption stays smaller.
- Change failure rate means execution quality. Lower failure means less rework, fewer support escalations, and less roadmap drag.
This is how delivery metrics become board material. You stop reporting activity and start showing operating performance.
Time to Value is the missing bridge
Shipping faster is useful. Getting customers to value faster is what changes the business.
A feature in production has no board value until it changes behaviour. It has to improve activation, shorten onboarding, increase adoption, reduce friction, or support expansion. If your reporting stops at release, you are measuring output while the business cares about outcomes.
That is why SaaS leaders should pair delivery metrics with product and commercial signals. Track adoption after release. Track support load after changes. Track whether onboarding got shorter, whether usage increased, and whether retention improved in the cohorts touched by the release.
For SaaS operators working on retention mechanics and lifecycle improvements, reducing churn with customer journey automation is a useful reminder that delivery speed only matters when it improves the customer path.
Here's a useful lens on the wider business picture:
Build a board-ready scorecard
A useful scorecard combines delivery performance, customer impact, and financial relevance in one view. That matters even more in a nearshore model, where leadership needs confidence that distributed execution still produces predictable business results.
A practical version might look like this:
| Delivery signal | Business interpretation | Board-level question |
|---|---|---|
| Lead time is falling | We are shortening decision-to-value cycles | Are product bets reaching customers fast enough to influence revenue this quarter? |
| Deployment frequency is rising safely | We can test and learn more often | Are we increasing experiment cadence without increasing support pain? |
| MTTR is low | Operational risk is contained quickly | Are outages staying small enough to protect trust and renewals? |
| Defect density and failure rate are stable | Quality is supporting scale | Are we protecting retention, support efficiency, and roadmap capacity? |
Use this scorecard in monthly operating reviews, not just engineering standups. Force every major delivery initiative to answer three questions. What customer outcome should improve, how quickly should it improve, and how will we know the release changed the business?
That discipline improves internal governance too. A release stops being marked "done" at deployment and starts being followed through to adoption, customer friction, and commercial impact. That is the difference between status reporting and real progress tracking for delivery outcomes.
If your board pack separates engineering delivery from business impact, you are asking leadership to manage half the system blind.
Avoiding Common Pitfalls and Metric Anti-Patterns
Bad metric cultures don't fail because they lack dashboards. They fail because leaders use metrics as a weapon, a vanity exercise, or a substitute for thinking.
That's why some teams hate measurement. They've lived through the version where leaders rank developers by output, compare unrelated teams, and chase one number until the system breaks somewhere else. If that's how you roll out software delivery metrics, expect distorted behaviour and shallow compliance.
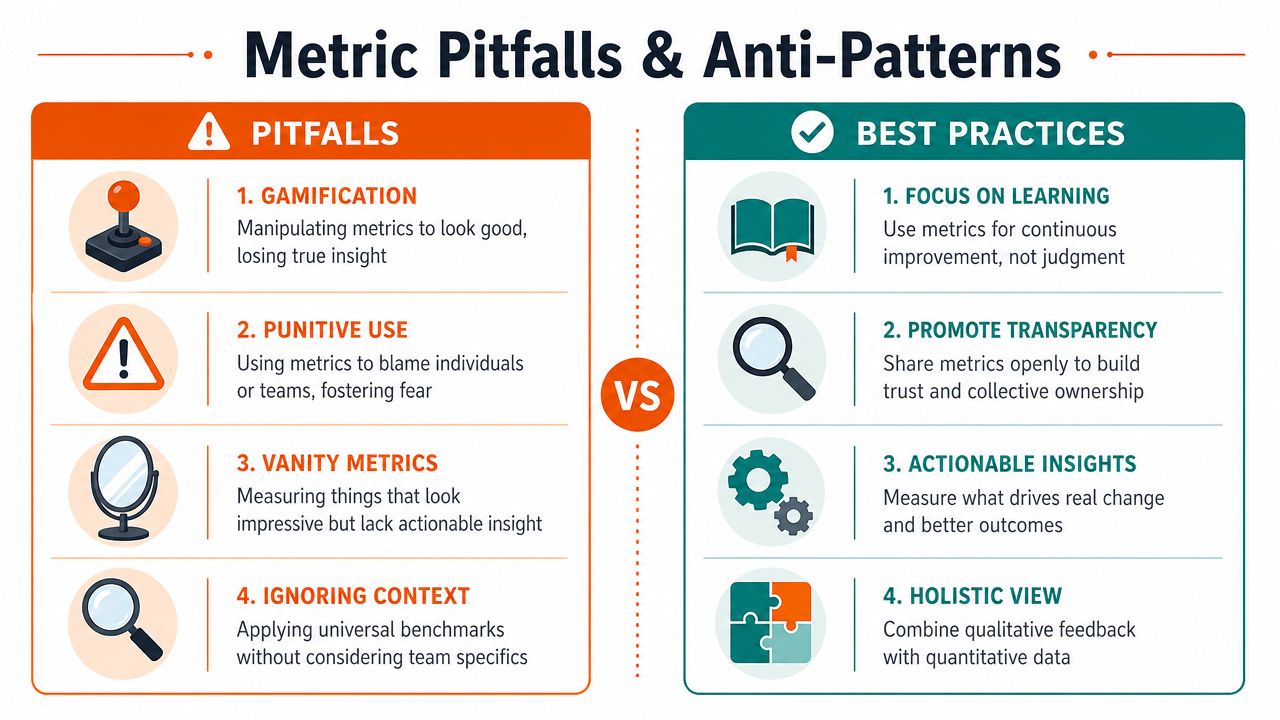
Four failure modes that show up fast
The anti-patterns are predictable.
- Gamification. Teams split work unnaturally, optimise for chart movement, and protect optics instead of outcomes.
- Punitive use. Leaders turn metrics into blame. Engineers stop surfacing risk early because they don't trust how data will be used.
- Vanity reporting. Dashboards multiply. Decisions don't improve.
- Context-free comparison. One team owns a legacy platform, another ships a greenfield product, and leadership pretends the same benchmark applies equally.
None of this builds capability. It builds fear and theatre.
The right response is ownership, not blame
The #riteway methodology matters. Extreme Ownership changes how a team responds to uncomfortable data. Instead of asking who caused the issue, the team asks what in the system allowed it, who owns the fix, and how fast they can close the loop.
That approach isn't soft. It's demanding. It requires engineers, product managers, and leaders to own delivery outcomes end to end, not just their narrow step in the chain.
The operational payoff shows up in stability. UK-based high-performing engineering teams that adopt Extreme Ownership cultures report a 52% reduction in Mean Time to Restore, dropping from an average of 4.2 hours to 2.0 hours, with proactive ownership and high-energy collaboration credited as the primary drivers, according to Hokstad Consulting's continuous delivery KPI benchmark.
Build a learning culture around the numbers
Use metrics to surface questions, not to end the conversation.
A healthy review sounds like this:
| Poor metric review | Strong metric review |
|---|---|
| “Why did your team miss the number?” | “What constraint is driving this trend?” |
| “Team A is better than Team B.” | “What differences in context explain the gap?” |
| “Push deployment frequency up.” | “What protects quality while throughput improves?” |
| “Who owns the failure?” | “Who owns the recovery and prevention plan?” |
Good metrics create clarity. Bad metrics create defensive behaviour.
Keep the system balanced
Never roll out one metric alone.
If you push deployment frequency without watching failure rate, teams can create motion that looks fast and behaves recklessly. If you obsess over change failure rate without watching lead time, teams can become so cautious that they stop learning from the market. If you talk about MTTR without discussing ownership and observability, recovery stays slow because no one can see enough to act quickly.
A strong metric culture has three traits:
- Transparency. Everyone understands how metrics are captured and why they matter.
- Context. Leaders interpret trends with architectural, product, and team realities in view.
- Action. Each review ends with a concrete improvement step, not just another dashboard screenshot.
That's the practical version of high energy and proactivity. Teams don't wait for a quarterly retrospective to fix a broken release process. They move.
Accelerate Your Results with a Proactive Delivery Partner
You can build this capability internally. You should. But you shouldn't pretend the learning curve is cheap.
Most SaaS companies lose time in the same places. They debate definitions for weeks, stitch together dashboards badly, struggle to connect engineering metrics to product outcomes, and still can't answer the board's predictability questions. The result is a slow transformation with weak adoption.
A mature delivery partner shortens that path because the operating model already exists. The discipline around instrumentation, ownership, release quality, and transparent reporting is built into how the team works from day one. That matters most in nearshore models, where speed is attractive but predictability is essential.
The tension is real. A key challenge for UK companies using nearshore teams is maintaining delivery predictability, especially Sprint goal accuracy, while accelerating MVP delivery. Nearshore teams often ship faster, but that speed can erode the accuracy of forecasts required by UK investors and CTOs. Delivery Accuracy is a critical but under-tracked metric, as discussed in InfoQ's analysis of critical software delivery metrics.
That's why the right partner doesn't just promise more throughput. It creates a delivery system where speed, visibility, and forecast confidence reinforce each other. Shared metrics, clear ownership, proactive communication, and product-first planning turn nearshore delivery from a capacity play into a strategic advantage.
If you're evaluating options, focus on more than technical skill. Ask how the partner measures lead time, release quality, recovery performance, and delivery accuracy. Ask how they make work visible across product, engineering, and leadership. Ask how quickly they can plug into your cadence without creating reporting friction. That's what separates staff augmentation from an actual software development services partner.
The fastest path isn't hiring more people and hoping the system improves. It's working with a team that already knows how to make software delivery metrics drive business value, not just engineering activity.
If you want a nearshore partner that treats metrics as business levers, not dashboard wallpaper, talk to Rite NRG. They help SaaS companies build and scale products with senior teams, transparent delivery, and an ownership-first model that keeps speed, quality, and predictability aligned.