You're probably already living this.
A customer reports that checkout is failing. Slack lights up. Someone opens Grafana. Someone else checks CloudWatch. A third engineer restarts a pod because CPU looks ugly. Product asks for an update. Sales wants to know whether a key account is affected. Nobody can answer the only question that matters.
Why did this happen?
That's the gap between dashboards and operational control. Basic monitoring tells you something crossed a threshold. Good observability tells you what changed, where it changed, and which dependency caused customer pain. For SaaS platforms, that difference isn't academic. It affects uptime, release confidence, support load, and whether your team spends its week shipping product or chasing ghosts.
Your Platform Is Down Do You Know Why
At 3 AM, an alert says: CPU at 95%.
That alert is technically correct and almost useless.
Your users don't care about CPU. They care that login is timing out, search is failing, and invoices aren't generating. Your team doesn't need more noise. It needs context. Which customer journeys are impacted? Which service changed? Is this an infrastructure event, a bad deployment, a database issue, or a downstream dependency failure?
The alert that wastes hours
A weak setup usually looks like this:
- Infrastructure-first alerts: CPU, memory, disk, and pod restarts flood the channel.
- No request-level context: You can't follow a failed transaction across services.
- Fragmented logs: App logs live in one tool, cloud events in another, and nobody trusts timestamps.
- Guess-driven response: Engineers restart things to buy time because they can't prove causality.
That's how incidents turn into expensive war rooms. The business cost shows up fast. Releases get delayed. Engineers lose trust in alerts. Leaders stop believing incident timelines. Customers feel the wobble before your team finds the root cause.
The alert that drives action
A stronger setup sounds different.
Instead of “CPU at 95%”, the system tells you that checkout API latency is spiking after a specific database query started slowing requests from one service path. That's an engineering starting point. It narrows the blast radius, points to ownership, and gives product and support a coherent update.
Practical rule: If an alert doesn't help the on-call engineer decide what to investigate next, it isn't helping. It's just interrupting.
Monitoring and observability both matter, but they solve different problems. Monitoring tells you that something looks wrong. Observability helps you explain why it went wrong across interacting components.
That distinction has deep roots. The modern field is commonly traced to control theory work on observability in the 1960s, and the ARPANET crash on 27 October 1980 is often cited as an early milestone that exposed the need to understand system behaviour from telemetry rather than from simple up/down checks, which helped frame observability as distinct from basic monitoring, as outlined in this history of observability.
For smaller teams, this isn't only an enterprise problem. Many of the same issues show up in lean environments, especially when cloud tooling accumulates faster than operational discipline. This practical guide to addressing SMB IT performance issues is useful because it highlights the practical pressure teams face when systems degrade and nobody has a reliable diagnostic path.
If your incident process still depends on whoever happens to remember where the logs are, fix that next. A clean escalation and recovery workflow matters as much as telemetry itself. This guide to incident response procedures is a strong starting point.
Monitoring vs Observability The Difference That Matters
Monitoring is your car dashboard.
Observability is the diagnostic toolkit a master mechanic uses when the engine makes a noise nobody expected.
That's the cleanest way to understand monitoring and observability.
What monitoring is good at
Monitoring works best when you already know what failure looks like. You define thresholds. You track specific metrics. You build dashboards around known risks.
That's valuable. You should absolutely monitor error rates, resource saturation, queue depth, latency, and deployment health. Known issues still need fast detection.
But monitoring has a hard limit. It can only answer the questions you thought to ask in advance.
What observability changes
Observability matters when your SaaS platform gets complicated enough that failure doesn't stay in one place. A request touches an API gateway, an auth provider, a cache, a message broker, a database, and maybe a third-party service. A customer sees one spinner. Your system contains six possible causes.
That's where observability earns its keep.
The technical reason observability became central is that it combines logs, metrics, and traces to investigate behaviour across distributed environments. Monitoring is limited to known thresholds, while observability supports investigation of unknown failure modes and cross-service dependencies. That shift is why observability now shows up early in engineering roadmaps, because it reduces the time needed to understand incidents, as explained in Netdata's guide to core observability metrics.
A simple comparison makes it clearer:
| Area | Monitoring | Observability |
|---|---|---|
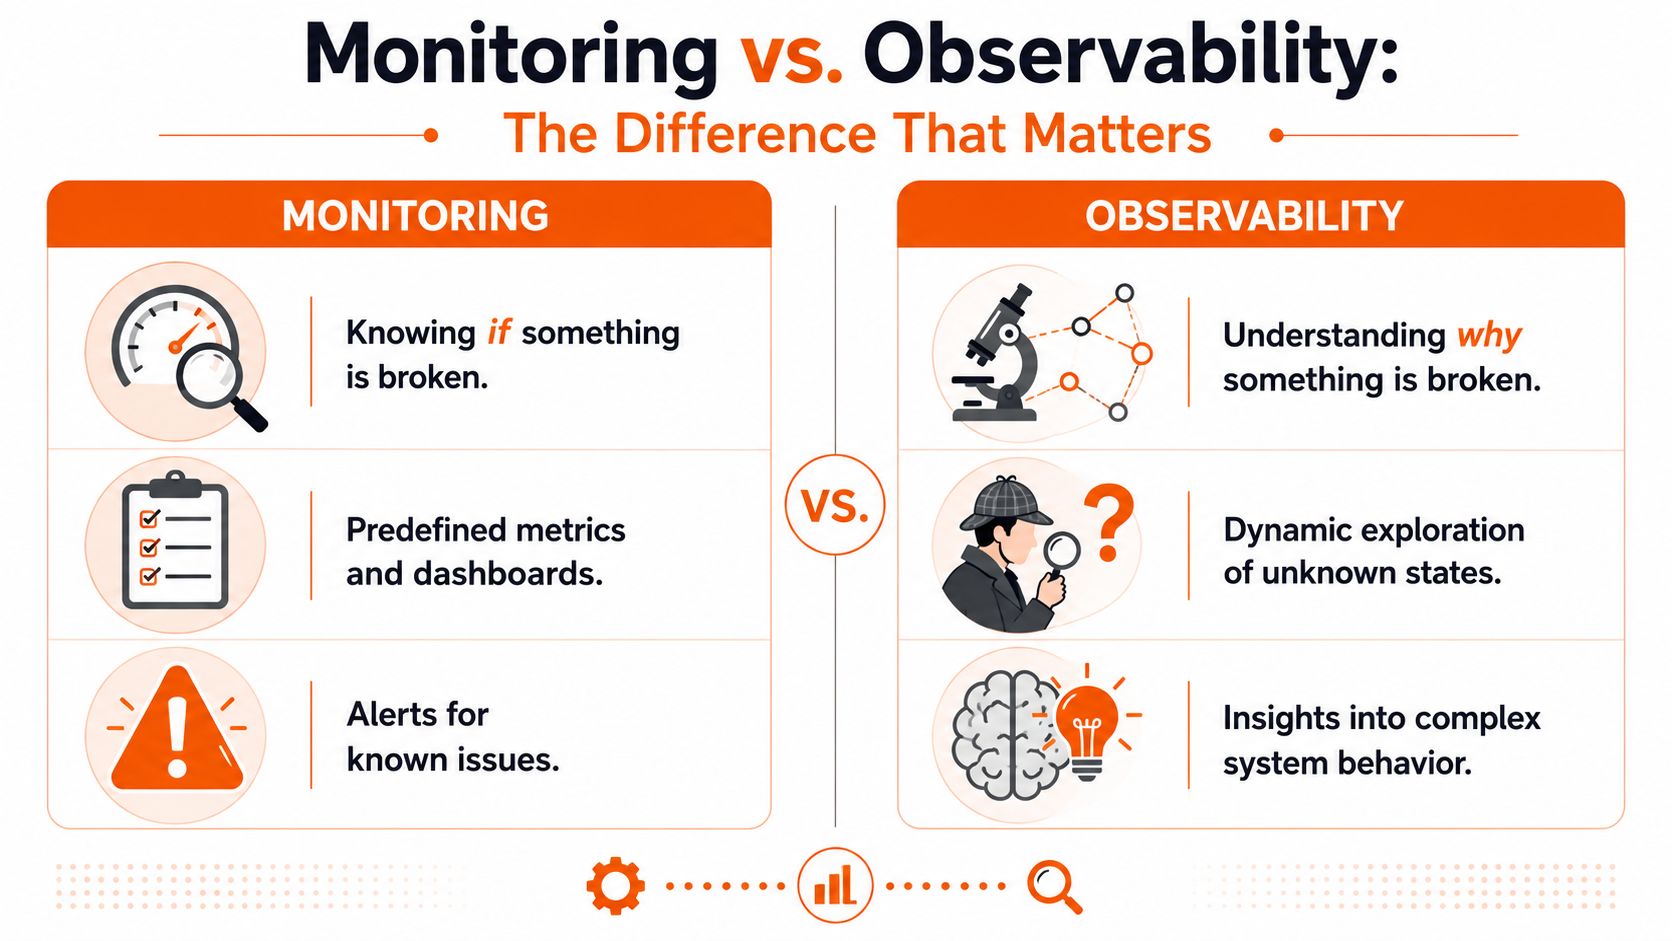
| Primary question | Is something broken? | Why is it broken? |
| Best for | Known conditions | Unknown conditions |
| Typical output | Dashboards and threshold alerts | Correlated investigation across telemetry |
| Failure handling | Detects symptoms | Helps uncover cause |
Here's a quick explainer if you want the visual version before reading on.
Why leaders should care
If you run a modern SaaS platform, your problem usually isn't lack of data. It's lack of diagnostic precision.
Observability reduces dead-end investigation. It cuts the time engineers spend jumping between tools. It also lowers a quieter but more damaging cost: burnout. Good people don't leave because systems are hard. They leave because every incident feels like archaeology.
Monitoring gives you signals. Observability gives your team a way to reason about the system under pressure.
If your stack is still mostly monolithic and stable, monitoring may cover more ground than you think. If you're already in microservices, Kubernetes, serverless, or multi-cloud, monitoring alone won't keep up.
The Three Pillars of Telemetry Data
Observability runs on telemetry. No telemetry, no answers.
The three core inputs are logs, metrics, and traces. Teams often collect all three, but many still treat them as separate reporting streams. That's the mistake. Their value comes from being used together.
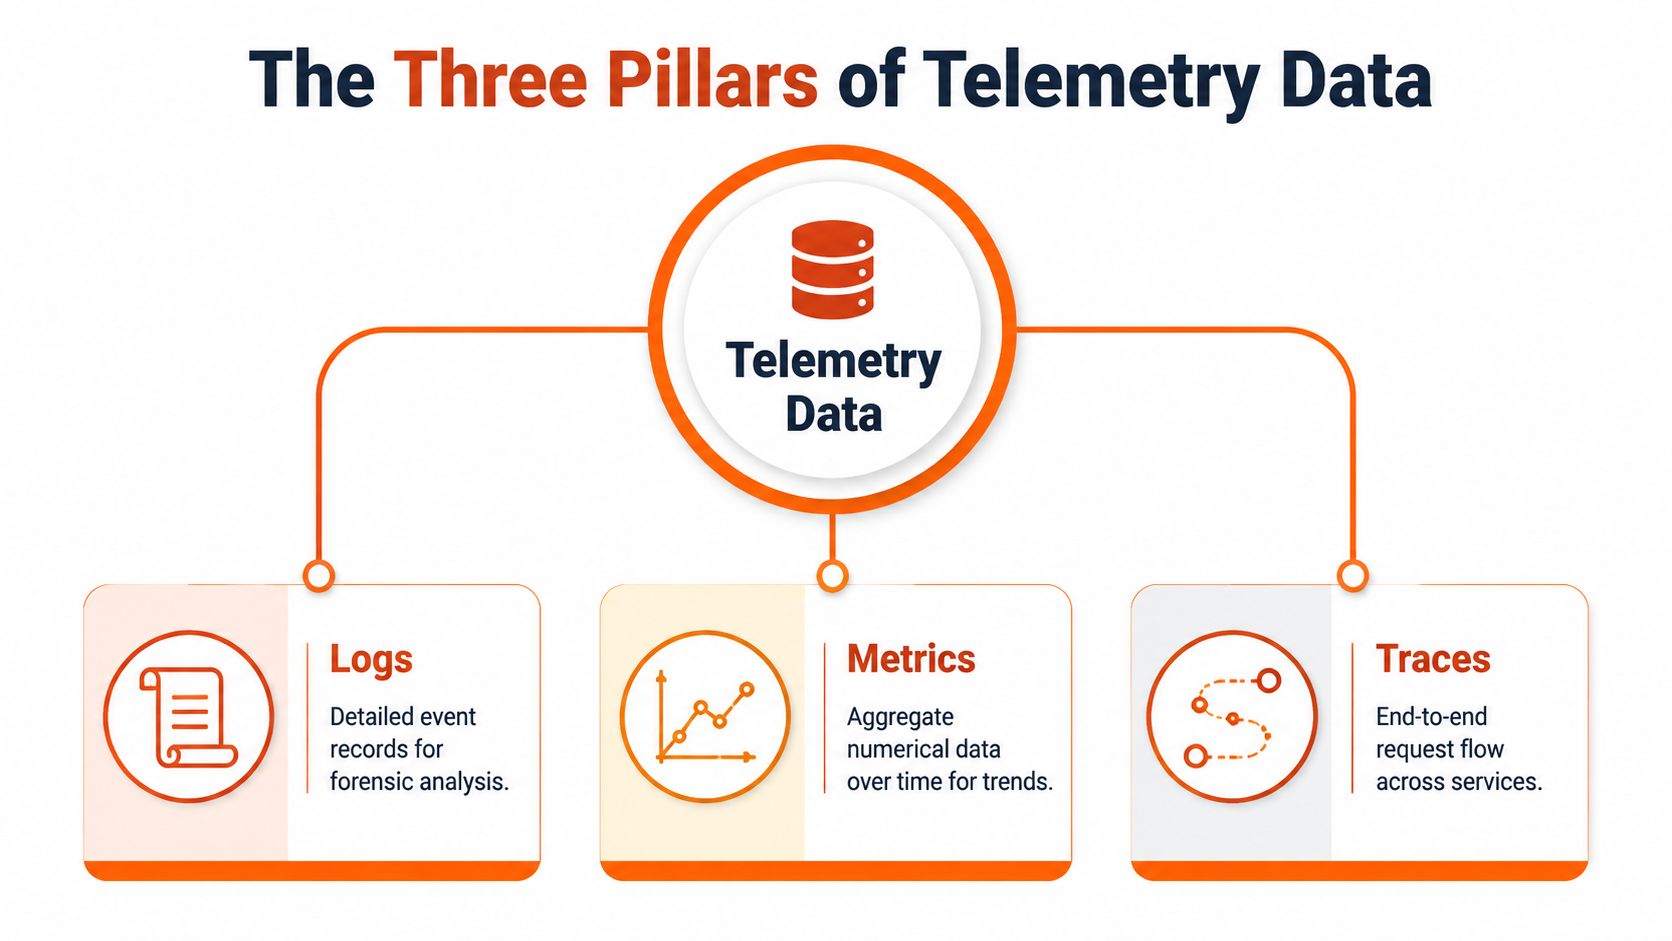
Logs are the diary
Logs are the event-by-event record. They tell you what happened, when it happened, and what the application said about it.
If one customer's payment failed, logs often hold the critical details. Validation errors. Authorisation failures. Timeout messages. Retry behaviour. Payload metadata, assuming you've designed structured logs properly and handled sensitive data correctly.
Logs are where forensic work begins.
Metrics are the summary
Metrics compress behaviour into numbers over time. They help you see trends, baselines, and anomalies quickly.
They're ideal for questions like these:
- Service health: Are error rates climbing?
- Performance drift: Is latency rising after a release?
- Capacity pressure: Are workers backing up during peak usage?
Metrics give you speed. They help teams scan the system and spot where to look next. They don't usually explain the whole story on their own.
Traces are the journey
Traces follow a single request across multiple services. That's what makes them so powerful in cloud-native systems.
If signup feels slow, traces show whether the delay sits in the API layer, a downstream call, a queue handoff, or a database query. You stop debating whose service is “probably fine” and start looking at the exact path the request took.
Operator's view: Metrics tell you there's smoke. Logs tell you what burned. Traces show how the fire spread.
UK public-sector cloud guidance puts this exactly where it belongs: at design time. It places strong emphasis on observability as a design requirement for resilient services, not an afterthought, because cloud-native systems need telemetry that supports both proactive detection and fast recovery. In practice, that means instrumenting services with traces, metrics, and structured logs from the start, as noted in this overview of the three types of observability.
What teams should implement first
Don't overcomplicate the starting point. Get disciplined on the basics.
Structured application logs
Plain text logs slow investigations down. Use consistent fields so engineers can filter by service, environment, request, and error condition.Service and endpoint metrics
Track latency, error behaviour, throughput, and saturation around the paths users care about.Distributed tracing on critical flows
Start with login, checkout, search, billing, and any workflow that directly affects revenue or retention.
This is also where non-functional requirements stop being theoretical. Reliability, latency, resilience, and diagnosability need to be treated as product constraints, not side notes. If your team needs a sharper way to frame that, this guide on what a non-functional requirement is is worth sharing internally.
An Observability Maturity Model for SaaS Platforms
A customer reports failed checkouts. Support sees the spike before engineering does. The dashboard shows red across three services, but nobody can explain whether the problem started in the API gateway, a recent deployment, or a downstream payment dependency.
That is the difference between collecting telemetry and running an observable platform.
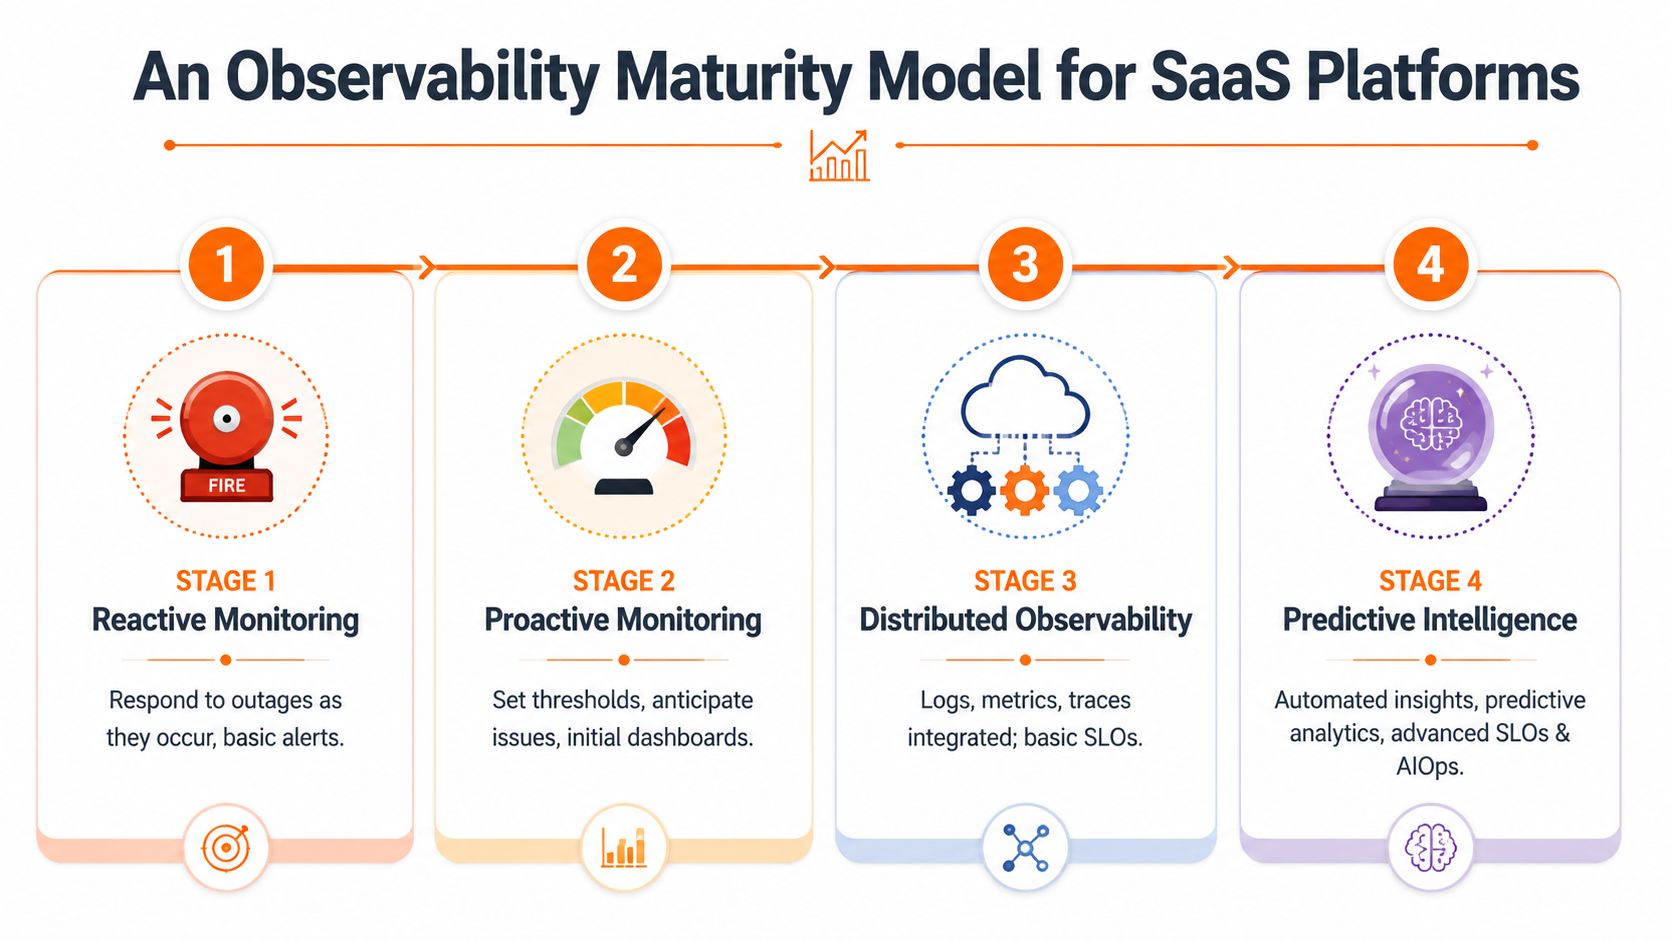
SaaS teams rarely jump from basic alerts to mature observability in one step. They progress through predictable stages. The smart move is to recognise your current stage early, fix the gaps that block business performance, and avoid wasting budget on tools that outpace your operating model.
Stage one is reactive monitoring
This is the starting point for many growing SaaS platforms. The team knows something is wrong after users complain, a host crosses a threshold, or a dashboard starts flashing.
The symptoms are familiar:
- Alerts focus on infrastructure, not customer experience
- Runbooks exist in fragments
- Incident response depends on a few experienced engineers
- Root cause analysis is slow and inconsistent
You have visibility, but not operational control. Every serious incident steals engineering time, slows delivery, and weakens trust across the business.
Stage two is proactive monitoring
At this stage, teams start detecting degradation before a full outage. Release checks improve. Ownership becomes clearer. Dashboards begin to reflect services and customer-facing flows instead of raw infrastructure alone.
This is useful progress, but the model still depends on expected failure patterns. It works well for known issues. It breaks down when the platform behaves in a new way, which is exactly what modern distributed systems do under load, after configuration drift, or during rapid product change.
A practical test is simple. Can your engineers explain why latency increased in one customer journey within minutes, or do they still jump between disconnected tools and opinions?
Stage three is foundational observability
A platform begins to operate with discipline.
Logs, metrics, and traces are correlated well enough to support investigation instead of guesswork. Engineers can follow a request across services, compare behaviour before and after a deployment, and isolate the service, dependency, or code path creating user impact. Incidents get shorter. Handoffs improve. Release confidence goes up because diagnosis no longer starts from zero.
Teams also become easier to scale at this stage. New engineers can work from shared telemetry instead of tribal knowledge. If your organisation is building stronger platform and DevOps capability, these Mindmesh Academy certification preparation resources can support that skill development.
Stage four is advanced observability
Advanced observability connects operational signals to product and business decisions.
The platform team can show which reliability issues affect conversion, retention, onboarding, or enterprise SLAs. Telemetry helps decide what to fix first, which changes are safe to release, and where engineering effort produces measurable return. On-call becomes calmer because noisy signals are filtered out before they hit the rota. Product, engineering, and leadership work from the same evidence.
That is the point of maturity. Better decisions. Faster recovery. Less wasted effort.
A useful maturity view looks like this:
| Stage | Operational posture | Main business outcome |
|---|---|---|
| Reactive monitoring | Respond after failure | Basic uptime awareness |
| Proactive monitoring | Detect degradation earlier | Fewer surprise outages |
| Foundational observability | Investigate unknown failure modes with correlated telemetry | Faster diagnosis and safer releases |
| Advanced observability | Tie system behaviour to user and business impact | Better prioritisation and more predictable delivery |
Treat this model as a roadmap, not a label. Teams do not need perfect tooling to progress. They need consistent instrumentation, service ownership, incident review discipline, and a clear plan for closing the gap between alerts and action.
That is where a delivery partner like Rite NRG changes the pace. We help SaaS platforms move from scattered signals to an operating model that supports growth, release speed, and reliability together. More data is easy. More useful decisions are what matter.
Implement SLOs Alerts and Tooling The Rite Way
Most alerting is built backwards.
Teams start with the tooling. They wire up Prometheus, Datadog, Grafana, New Relic, CloudWatch, Elastic, or OpenSearch. Then they ingest everything they can find. Then they create more alerts than any human should ever receive. The result is predictable. Noise wins.
The fix is simple in principle and demanding in practice: define reliability from the user's point of view first.

Start with service level objectives
An SLO is a target for a service behaviour that users experience. Not host utilisation. Not pod count. Not database CPU in isolation.
Good SLOs focus on journeys such as login success, checkout latency, search responsiveness, or webhook processing reliability.
That changes alert quality immediately. Instead of waking engineers for a noisy infrastructure wobble, you alert when user impact crosses a meaningful threshold. That's a healthier operating model and a better business model.
Build alerts around symptoms customers feel
Use infrastructure metrics as supporting evidence, not as the star of the show.
A practical alert stack should separate these layers:
- User-impacting alerts: Failed requests, degraded latency, broken core workflows
- Service health alerts: Dependency failures, queue congestion, saturation on critical services
- Diagnostic signals: Host anomalies, container churn, deployment events, autoscaling behaviour
This order matters. When everything is urgent, nothing is urgent.
The best alert is the one your on-call engineer trusts enough to act on immediately.
Get correlation right
The National Cyber Security Centre treats logging and monitoring as a core defensive control for detecting suspicious activity and investigating incidents. It recommends centrally collecting logs, synchronising system clocks, and retaining events long enough to support forensic analysis and correlation across hosts and services. For observability teams, that's more than security hygiene. It's the basis for incident reconstruction, and better correlation reduces blind spots, as summarised in Honeycomb's discussion of observability components and practices.
That has direct execution implications:
Centralise telemetry
Don't make responders hunt across five consoles during an incident.Synchronise timestamps
If clocks drift, your timeline lies.Preserve request context
Correlation IDs, span IDs, deployment markers, and environment tags should travel with the event.
Choose tools with discipline
Open-source stacks can be excellent. Prometheus, Grafana, OpenTelemetry, Jaeger, Tempo, Loki, and OpenSearch give capable teams a lot of control.
Commercial platforms can also be the right choice when speed, support, and integrated workflows matter more than internal platform overhead.
The decision criteria are practical:
| Question | What to test |
|---|---|
| Can engineers query across logs, metrics, and traces easily? | Investigation speed during live incidents |
| Does the tool support open standards? | Lower lock-in risk |
| Can you control telemetry volume? | Sustainable operating cost |
| Will teams actually use it under pressure? | Usability beats feature count |
Don't buy for demos. Buy for your incident reality.
Scale Your Platform with Governance and a Partner
Observability usually breaks at scale for boring reasons, not technical ones.
Data volume balloons. Retention policies drift. Teams instrument everything and govern nothing. Different squads choose different labels, dashboards, and alert rules. Finance sees the bill. Engineering sees the noise. Nobody owns the operating model.
That's where monitoring and observability become a leadership problem.
Treat telemetry like a product
Telemetry has cost, consumers, standards, and lifecycle decisions. Govern it accordingly.
The ONS reported that 43% of UK businesses experienced some form of cyber security breach or attack in the last 12 months, which pushes organisations toward richer telemetry and higher ingestion volumes, as highlighted in AWS's comparison of monitoring and observability. More data can improve investigations. It can also easily become a spending problem if you retain everything forever and alert on anything that moves.
A better operating model includes:
- Retention by value: Keep high-value forensic and compliance data longer. Age out lower-value noise.
- Sampling with intent: Trace the critical paths thoroughly. Don't ingest every low-signal event at the same level.
- Alert ownership: Every alert should have a team, an action, and a review cadence.
- Instrumentation standards: Naming, tags, service boundaries, and event schemas should be consistent across squads.
Stop assuming you must build it all in-house
A lot of companies make the same expensive mistake. They assume observability maturity requires hiring a full internal platform capability from scratch before they can operate well.
It doesn't.
What you need first is senior judgement. Someone has to define what matters, which services need deeper instrumentation, how to align telemetry with delivery, and where to control cost before it becomes a board-level annoyance.
That capability can be built internally over time. But it doesn't need to start there, and often shouldn't. The fastest route is usually a blended model: experienced external operators establish the standards, tooling patterns, and incident discipline, then transfer capability into your team.
Build governance into the platform layer
This work belongs close to platform engineering, architecture, and delivery leadership. It also connects tightly to automation. If your provisioning, environments, and service definitions are inconsistent, your telemetry will be inconsistent too. Strong infrastructure as code practices make observability easier to standardise because instrumentation, labels, deployment metadata, and environment conventions stop being manual afterthoughts.
Observability scales when ownership is clear. It fails when every team emits data but nobody designs the system around decision-making.
The strongest SaaS teams don't treat observability as a tool purchase. They treat it as an operational capability tied to release quality, customer trust, and engineering efficiency. That's the right frame. More dashboards won't save a weak operating model. Better governance will.
If your team is stuck between noisy monitoring and real observability, Rite NRG can help you close that gap with senior engineers, product-minded delivery, and a practical Build-Operate-Transfer model. The goal isn't more telemetry. It's faster diagnosis, cleaner releases, and a SaaS platform that scales without operational chaos.